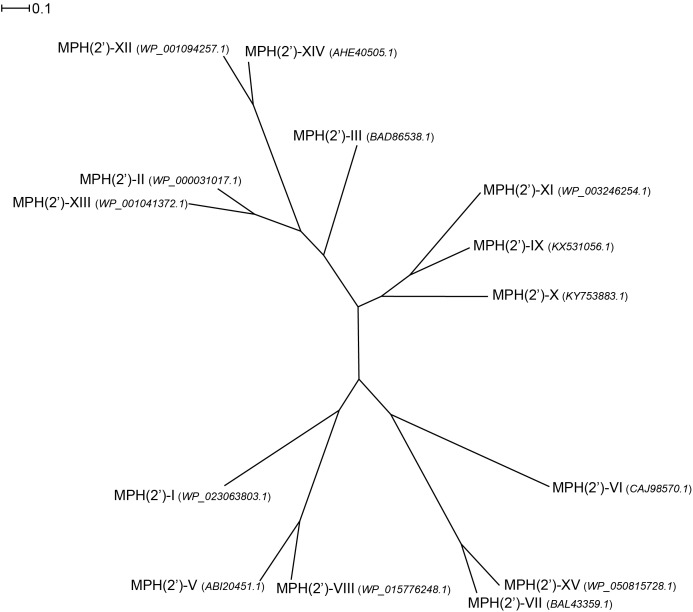
FIGURE 4.
Radial phylogram of MPH family of proteins. NCBI accession codes for the sequences are provided in brackets. Distance scale represents the number of differences between sequences (e.g., 0.1 means 10% differences between two sequences). Phylogenetic relationships were calculated using phylogeny.fr (Dereeper et al., 2008) and displayed using Dendroscope 3 (Huson and Scornavacca, 2012).

