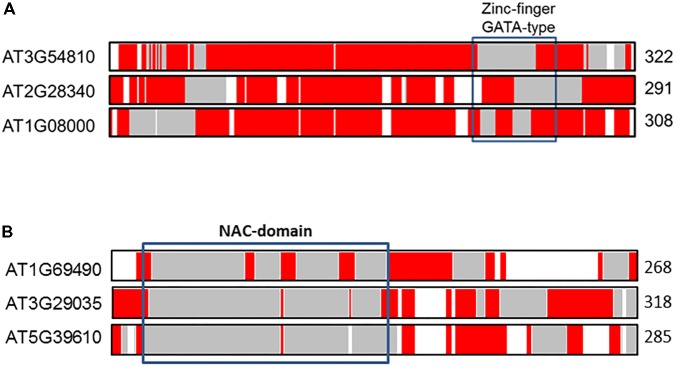
FIGURE 4.
Alignments of the co-linear GATA10 (A) and NAC92 (B) paralogs in A. thaliana. The protein length is given to the right of each sequence. The color coded bars in each sequence depict predicted disorder. Disordered residues are shown in red, ordered residues are shown in gray, and alignment gaps are shown in white. Typical DNA-binding domains are shown as black boxes.

