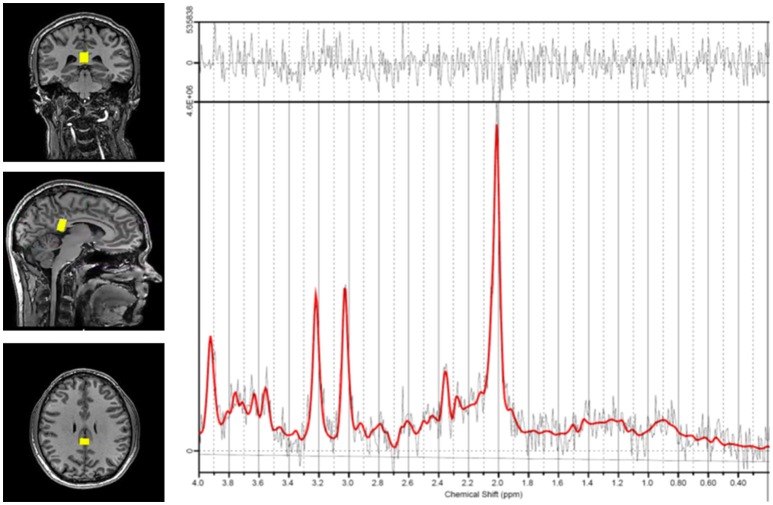
Figure 1.
Representative spectrum and voxel location. Voxel positioning in the corpus callosum is shown on the left. The spectrum derived from measurements in this region is shown on the right. The red line indicates the basis set fit of the acquired data (black lines) and the bar at the top shows the residual difference between the fit and the spectrum.

