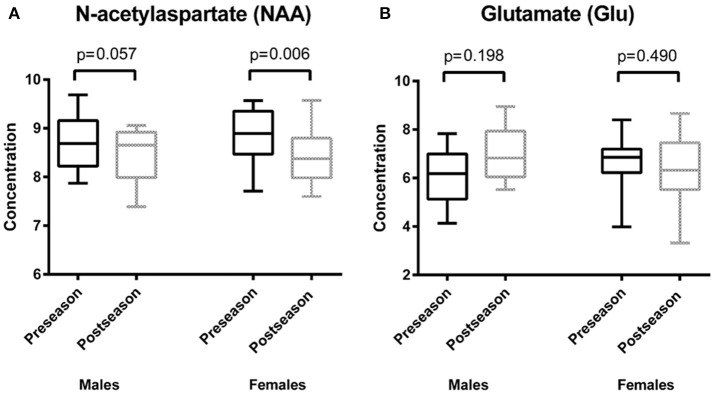
Figure 2.
Results of repeated measures analysis of covariance (A) depicts box plots of average values of the concentration of N-acetylaspartate (NAA) at two time points: preseason and postseason. There was a statistically significant difference between pre-and postseason NAA concentrations (p = 0.001). In both males and females, NAA decreased when comparing the preseason to the postseason concentrations (males: p = 0.057, females: p = 0.006). (B) shows box plots of average values of the concentration of glutamate (Glu) at two time points: preseason and postseason. There was a trend regarding the difference between pre- and postseason Glu concentrations (p = 0.039). Females showed a decrease in Glu over time (p = 0.490), whereas males had an increase in Glu over time (p = 0.198).

