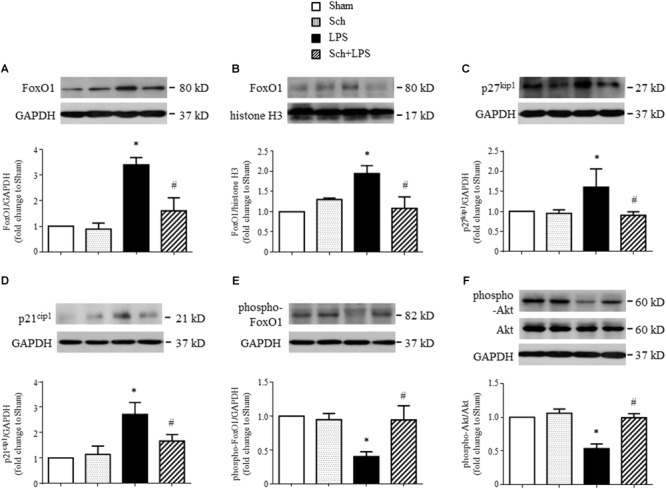
FIGURE 9.

Sch inhibits FoxO1 activation at 8 h after the termination of LPS infusion. (A,B) Representative Western blots and quantitative analysis of FoxO1 expression in cytoplasm (A) and nuclei (B) in different groups. (C,D) Representative Western blots and quantitative analysis of p27kip1 (C) and p21cip1 (D) in different groups. (E,F) Representative Western blots and quantitative analysis of FoxO1 (E) and Akt (F) phosphorylation in different groups. Values are expressed as mean ± SD of 5 separate experiments. Sham, sham group; Sch, sch alone group; LPS, LPS infusion for 90 min group; Sch + LPS, Sch pretreatment at 2.5 mg/kg/h followed by LPS infusion for 90 min group. ∗p < 0.05 vs. Sham group, #p < 0.05 vs. LPS group.
