Figure 1.
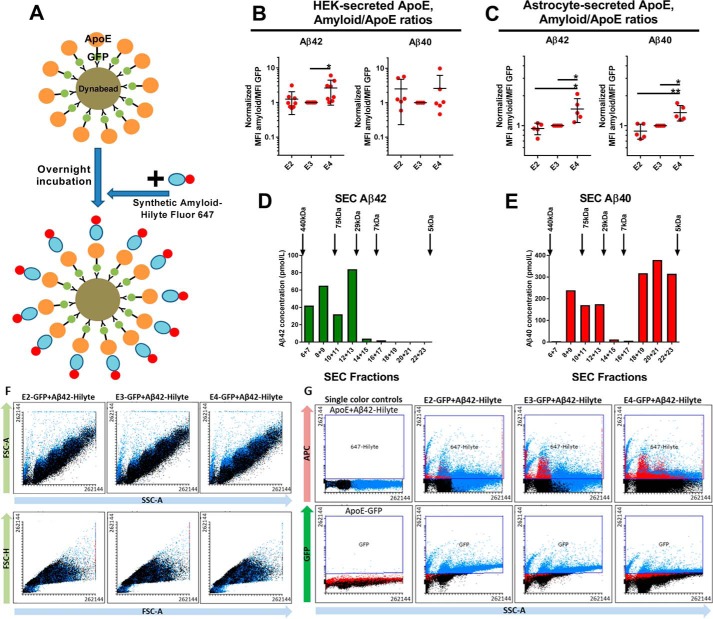
Assessment of the interaction between ApoE and synthetic Aβ using flow cytometry. A, diagram illustrating the process of the experiment. First, ApoE is attached to Dynabeads. After overnight incubation, synthetic Aβ fused with 647Hilyte is added to the sample, and they are analyzed through flow cytometry 4 h later. B, plot indicating the Aβ/ApoE ratios for HEK-secreted ApoE. E4 interacts more strongly with Aβ42 compared with E2 and E3. However, this pattern is not present in the case of Aβ40. Number of independent experiments: Aβ42, 8; Aβ40, 6. C, plot indicating the Aβ/ApoE ratios for astrocyte-secreted ApoE. E4 interacts more strongly with Aβ42 and Aβ40 compared with E2 and E3. Number of independent experiments: Aβ42, 5; Aβ40, 5. D, SEC for synthetic Aβ42 shows that it forms medium- to high-molecular-mass complexes ranging from ∼7–440 kDa. E, SEC for synthetic Aβ40 shows primarily low-molecular-mass complexes from 5–75 kDa, with little formation of medium-sized complexes. F, forward scatter (FSC) and side scatter (SSC) plots for E2, E3, and E4, indicating that there are no differences between isoforms. G, fluorescence plots for E2, E3, E4, and single-color controls. In these plots, each dot represents the mean value from one independent experiment. The data were normalized to E3 before meta-analysis. Statistical analysis was done with one-way ANOVA with Tukey's post hoc correction. Mean ± S.D. is shown in the plots. **, p ≤ 0.01; *, p ≤ 0.05.

