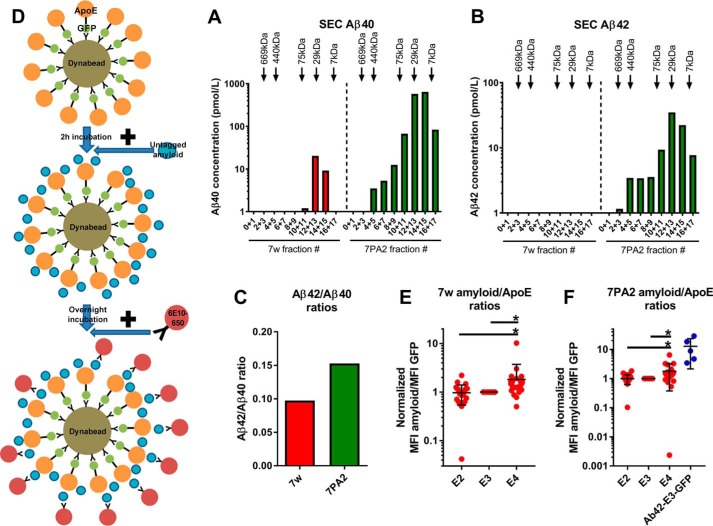
Figure 2.
Interactions between HEK-secreted ApoE and physiological Aβ as determined by flow cytometry. A–C, characterization of Aβ secreted from the 7w and 7PA2 cell lines. Results from one representative experiment are shown in the plots. A and B, Aβ40 (A) and Aβ42 (B) concentrations in 15-fold concentrated CM from 7w and 7PA2 cell lines after SEC. The Aβ secreted from both cell lines forms mainly low to intermediate-molecular-mass complexes, but the size of those complexes ranges between 7–75 kDa. C, ratios of Aβ42/Aβ40 concentrations in the CM of 7w and 7PA2 cell lines. The ratio is higher for the 7PA2 than for the 7w line, suggesting that 7PA2 cells secrete proportionately more Aβ42. D, diagram illustrating the process of the experiment. First, ApoE is attached to Dynabeads. 2 h later, CM from the 7w or 7PA2 cell line is added to the ApoE–Dynabead complex. After overnight incubation, the 6E10 anti-Aβ antibody that was first conjugated to 650Dylight is added to the samples and incubated for 5.5 h before flow cytometry. E, plot indicating the Aβ/ApoE ratios for HEK-secreted ApoE incubated with 7w CM. E4 interacts more strongly than E2 and E3 with 7w Aβ. Number of independent experiments: E2, 24; E3, 24; E4, 23. F, plot indicating the Aβ/ApoE ratios for HEK-secreted ApoE incubated with 7PA2 CM. E4 interacts more strongly than E2 and E3 with 7PA2 Aβ. Number of independent experiments: E2, 20; E3, 20; E4, 20; Aβ42-E3-GFP, 5. In these plots, each dot represents the mean value from one independent experiment. The data were normalized to E3 before meta-analysis. Statistical analysis was done with one-way ANOVA with Tukey's post hoc correction. Mean ± S.D. is shown in the plots *, p ≤ 0.05.

