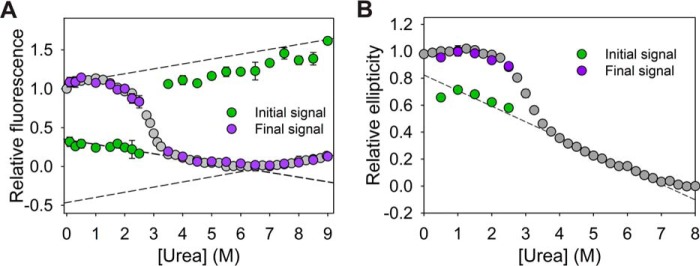
Figure 4.
Initial and final signal analysis of single-jump kinetics studies. A and B, initial (green) and final (purple) signals of refolding (for Trp fluorescence and CD probe, respectively) and unfolding (Trp fluorescence probe) obtained by extrapolation of kinetics traces to the zero time of mixing are overlaid with corresponding equilibrium unfolding curves. Error bars represent standard deviation from three individual experiments.

