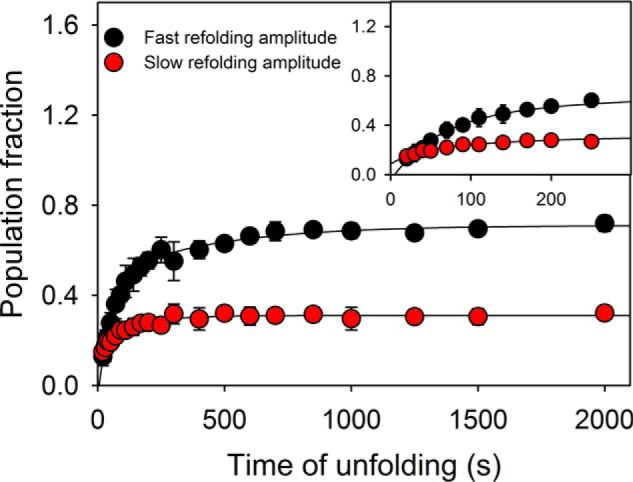
Figure 6.

Interrupted unfolding experiments. The native protein unfolded at 8 m urea for different time periods was allowed to refold rapidly by dilution to 1 m urea. The biphasic refolding traces provide two amplitudes, which are plotted against time of unfolding. The plot excludes the possibility of prolyl-peptide isomerization mediated conformation heterogeneity in the unfolded population. The error bars represent standard deviation from three separate experiments.
