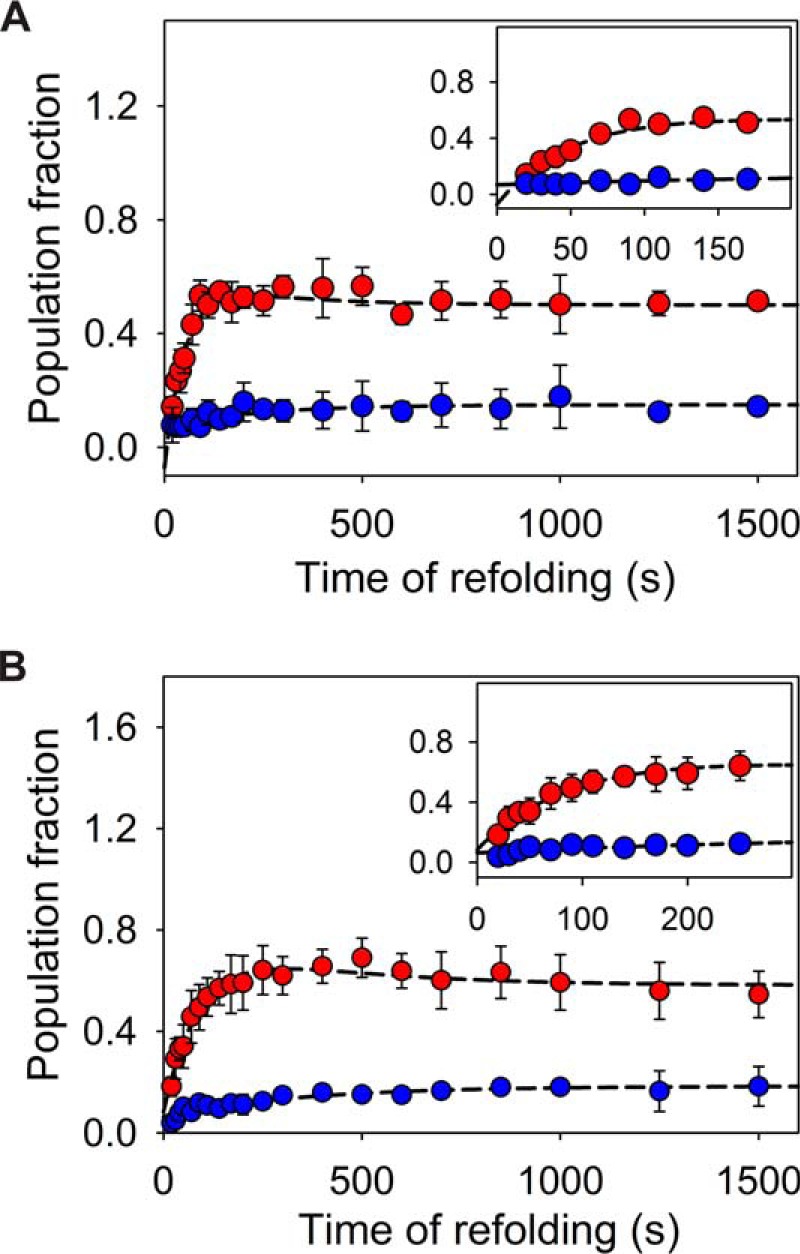
Figure 7.

Interrupted refolding studies. A, MSG was allowed to refold at 0.1 m urea for different time points, followed by unfolding at 7 m urea. The plots of two unfolding amplitudes against time of refolding represent kinetics of stable species present in the system. The amplitudes probed by phase-1 (fast phase at 7 m urea) of unfolding (red) (Fig. 3D) show a rapid build-up of the intermediate species (fast refolding phase), which undergoes a slow decay (slow refolding phase) (Table S2). The amplitudes of slow unfolding phase (blue) exhibit slow single exponential increase. B, interrupted refolding study for refolding of MSG at 2 m urea. The error bars represent the standard deviation of three independent experiments. Although the slow decrease in the accumulated population near ∼150–200 s is found to be consistent (and easily perceptible for refolding at 2 m urea), the large error bars are obtained as a consequence of the range of amplitudes from independent set of experiments.
