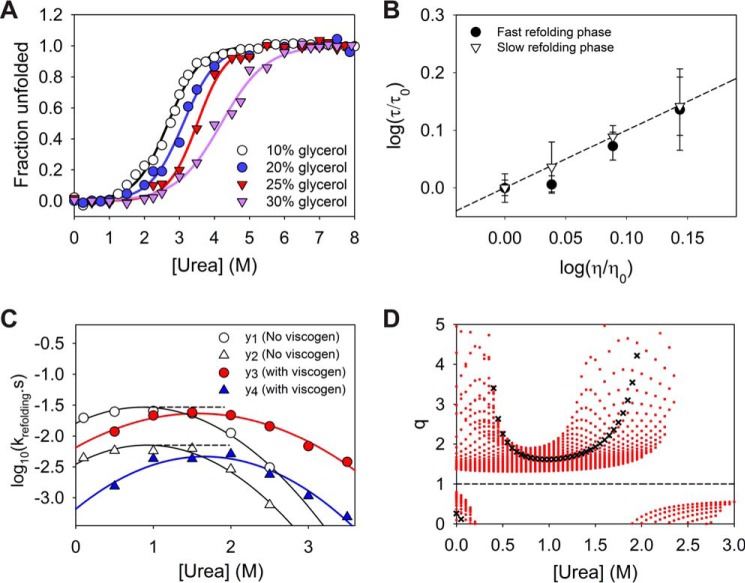
Figure 8.
Effect of viscogenic conditions on refolding kinetics. A, effect of glycerol addition on the stability of MSG. The solid lines represent two-state fit of the data points considered until 8 m urea (limited solubility of urea in presence of glycerol). The equilibrium plots were found to be reversible except in case of 30% glycerol (Fig. S7). A similar cooperativity index until 25% of the viscogen ensures minimal relative alteration of the energy landscape due to glycerol. B, plot indicates a linear effect of dynamic viscosity of the solvent on two refolding rates and excludes any possibility of alteration in the free energy of refolding due to presence of glycerol. C, comparison of refolding rates for both phases under normal native conditions (10% glycerol) and viscogenic conditions (25% glycerol) where yi = log10ki. The higher effect of the viscogen on the slow refolding phase can be observed visually. D, as the stability of protein increases appreciably in presence of viscogen like glycerol, the comparison in refolding rates is only viable under equal stability of native state with respect to denatured conformation (isostable conditions). For simpler systems (two-state systems) the isostability is achieved by addition of denaturant to the refolding solution under viscogenic conditions to exactly counter the resulting stabilization. For multistate protein MSG, the relative alteration in the slow refolding rate as compared with that of faster phase, i.e. q (= (y2 − y4)/(y1 − y3)), is explored under different practical urea increments for achieving isostability, and it was found to be greater than 1 always. The red dots for each urea concentration indicate multiple q values obtained for increments of 0.05 m urea intervals. The black crosses represent q values for isostable conditions under the approximation of two-state behavior of the protein as shown in A. Under two-state assumption, the rates of refolding in native buffer at 1 m urea can be directly compared with refolding rates at 1.61 m urea in viscogenic conditions. Error bars represent the standard deviation of three individual studies.

