Figure 1.
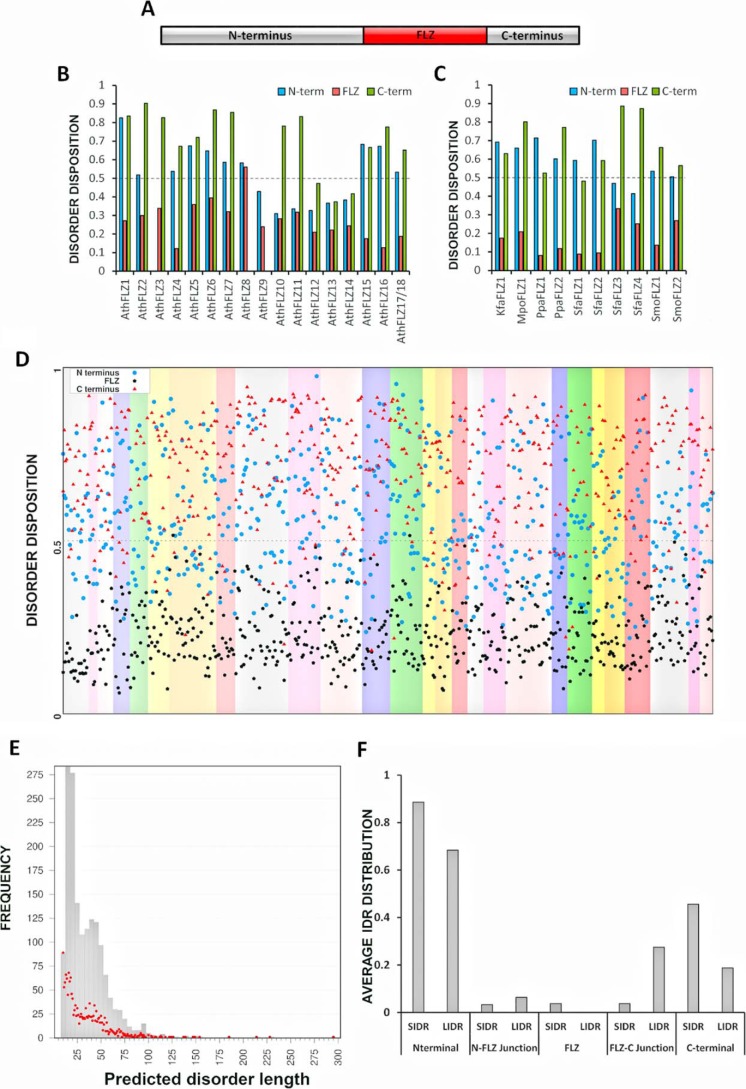
Disorder in FLZ protein family across the plant lineage. A, schematic representation of domain structure of FLZ proteins. The domain structure of Arabidopsis FLZ1 is shown here as an example. B, average disorder of different regions of FLZ proteins from Arabidopsis thaliana (Ath). C, average disorder of different regions of FLZ proteins from K. flaccidum (Kfa), Marchantia polymorpha (Mpo), Physcomitrella patens (Ppa), Sphagnum fallax (Sfa), and Selaginella moellendorffii (Smo). D, average disorder of different regions of FLZ proteins from 28 Spermatophyta proteomes. Each species is shown in different background colors. E, relationship between IDR length and frequency of occurrence in FLZ protein family. The bars indicate the relationship between IDR length and frequency after categorizing IDRs into groups based on length. The IDRs with a length difference of up to five amino acids were grouped together. The red dots indicate the relationship between IDR length and frequency without any grouping. F, average distribution of short (SIDR; 10–29 residues) and long (LIDR; 30 or more residues) IDRs in different regions of FLZ protein family. The detailed table of IDRs in FLZ protein family is given in Table S3.

