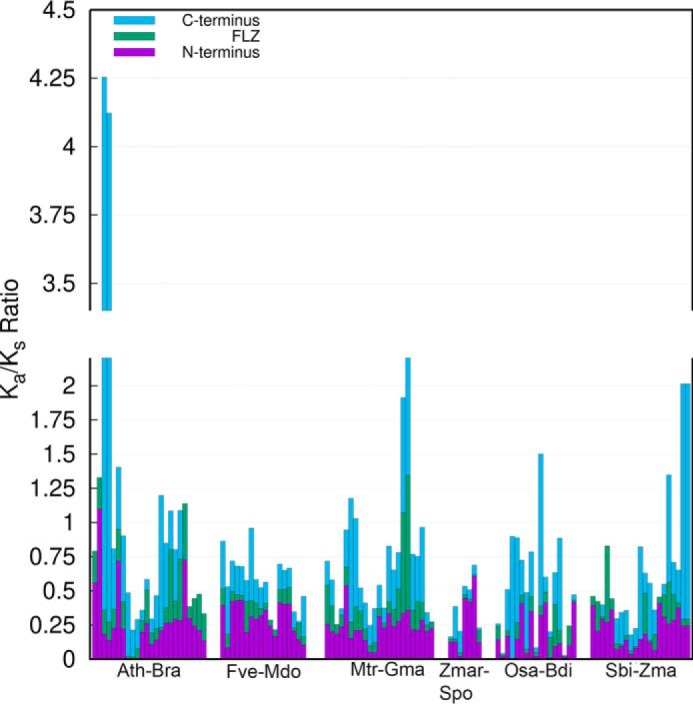
Figure 10.

Estimation of sequence divergence rate in different regions of FLZ proteins. The Ka/Ks ratio between putative orthologous FLZ genes from 12 different angiosperms was calculated. The cumulative ratio of each orthologous gene pair is represented by single bar. The Ka/Ks ratio of each region of the gene pair is marked by different color. The detailed table of Ka/Ks estimation is given in Table S5. The species used for this analysis were abbreviated in the graph as follows: A. thaliana (Ath); Brassica rapa (Bra); Fragaria vesca (Fve); Malus domestica (Mdo); Medicago truncatula (Mdo); Glycine max (Gma); Zostera marina (Zmar); Spirodela polyrhiza (Spo); Oryza sativa (Osa); Brachypodium distachyon (Bdi); Sorghum bicolor (Sbi); and Zea mays (Zma).
