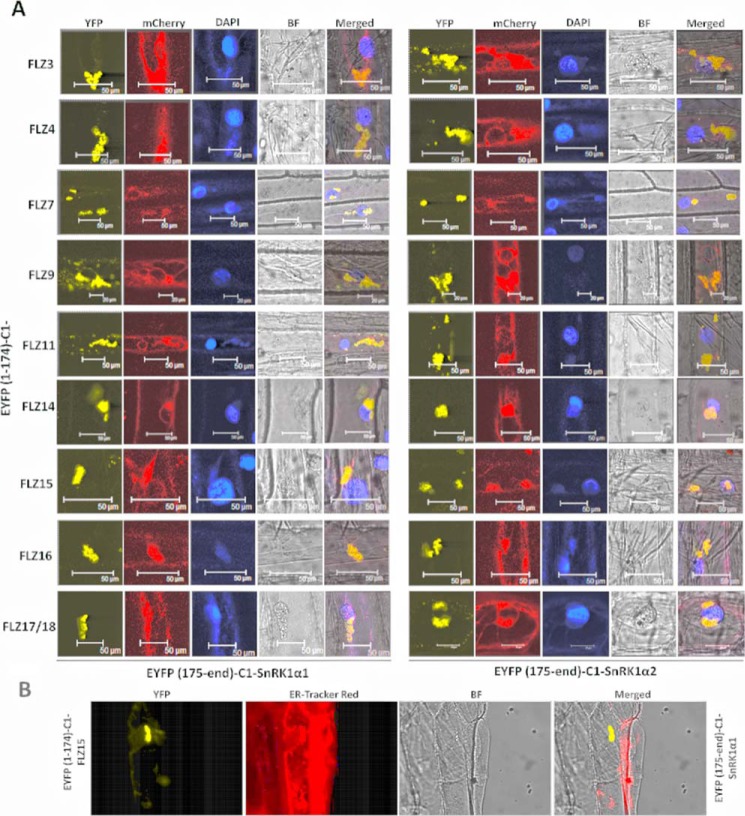
Figure 6.
In planta interaction of FLZ proteins with SnRK1α kinase subunits. A, BiFC analysis of the interaction of FLZ proteins with SnRK1α1 and -α2. The whole cell representation is given in Fig. S6. FLZ proteins were fused to (YFP(1–174)) N terminus of YFP, and SnRK1α1 and -α2 were fused with (YFP(175-end)) C terminus of YFP. The interactions were co-localized with ER marker construct fused with mCherry. B, colocalization of FLZ15–SnRK1α1 interaction with ER–Tracker Red. Wavelengths used for activation/detection (absorption/emission) of the fluorophores: YFP(514/530 nm); DAPI (351/450 nm); mCherry (575/610 nm); ER–Tracker Red (587/615 nm).

