Abstract
Genes are transcribed in irregular pulses of activity termed transcriptional bursts. Cellular differentiation requires coordinated gene expression; however, it is unknown whether the burst fraction (i.e. the number of active phases of transcription) or size/intensity (the number of RNA molecules produced within a burst) changes during cell differentiation. In the ocular lens, the positions of lens fiber cells correlate precisely with their differentiation status, and the most advanced cells degrade their nuclei. Here, we examined the transcriptional parameters of the β-actin and lens differentiation–specific α-, β-, and γ-crystallin genes by RNA fluorescent in situ hybridization (FISH) in the lenses of embryonic day (E) E12.5, E14.5, and E16.5 mouse embryos and newborns. We found that cellular differentiation dramatically alters the burst fraction in synchronized waves across the lens fiber cell compartment with less dramatic changes in burst intensity. Surprisingly, we observed nascent transcription of multiple genes in nuclei just before nuclear destruction. Nuclear condensation was accompanied by transfer of nuclear proteins, including histone and nonhistone proteins, to the cytoplasm. Although lens-specific deletion of the chromatin remodeler SWI/SNF-related matrix-associated actin-dependent regulator of chromatin subfamily A member 5 (Smarca5/Snf2h) interfered with denucleation, persisting nuclei remained transcriptionally competent and exhibited changes in both burst intensity and fraction depending on the gene examined. Our results uncover the mechanisms of nascent transcriptional control during differentiation and chromatin remodeling, confirm the burst fraction as the major factor adjusting gene expression levels, and reveal transcriptional competence of fiber cell nuclei even as they approach disintegration.
Keywords: differentiation, crystallin, lens, chromatin remodeling, gene transcription, Denucleation, nascent transcription, RNA FISH, Snf2h (Smarca5), transcriptional bursting
Introduction
Studies of nascent transcription in a range of cell lines, primary cells, and a few tissues have shown that it occurs in bursts, i.e. oscillating between periods of activity and inactivity (1–3). Nascent RNA transcription can be visualized by RNA fluorescent in situ hybridizations (RNA FISH)2 (4). Transcriptional bursting originates from stochasticity of transcriptional component concentrations and localization within a population of cells (5–7). During the active period, groups of closely spaced RNA polymerases II, termed convoys, originate by the Mediator-dependent re-initiation mechanisms at the promoter and transcribe the downstream DNA (8, 9). Quantitatively, it has been shown that individual cells modulate transcriptional output by regulating the number of active phases of transcription (“burst fraction”) and/or the number of nascent RNA molecules produced within a burst (“burst size”); the duration of active and inactive phases of transcription (“burst duration”) is another quantitative parameter (10). The number of active transcription sites (TSs) in a cell population can be used to measure the burst fraction. The burst fraction is related to the proportion of time each TS transcribes the gene when live cell recordings are conducted or to the proportion of active alleles per multiple individual nuclei when nascent transcription is analyzed by RNA FISH in fixed cells or tissues (5, 11, 12). Although a number of studies investigated bursting parameters in unicellular organisms and cultured cells, very little is known about how cellular differentiation in mammalian tissues is regulated by transcriptional bursting (11–13).
Cellular differentiation is marked by an increased expression level of batteries of genes encoding proteins needed for cell specialization and complex organ formation. Tissue-specific gene expression is typically regulated by a tissue-specific promoter coupled with multiple differentiation-regulated distal enhancers or by a promoter regulated by one or more tissue-specific enhancer(s) (14, 15). Recent studies have shown that enhancers control burst fraction in Drosophila embryos (16) and mammalian erythrocytes (17). Individual core promoter elements of a major histocompatibility complex class I gene promoter contribute to burst frequency, size, or both in response to γ-interferon stimulation (18). The transcription factor concentration, after MAPK induction, also modulates the c-Fos burst fraction in cultured cells (19). Interestingly, the lifetime of RNA polymerase II convoys, as well as the number of mRNAs synthesized, is increased following serum stimulation of the β-actin gene in cultured fibroblasts (20). However, how individual cells and tissues manage their transcriptional outputs during in vivo cellular differentiation to control burst fraction and size remains unknown.
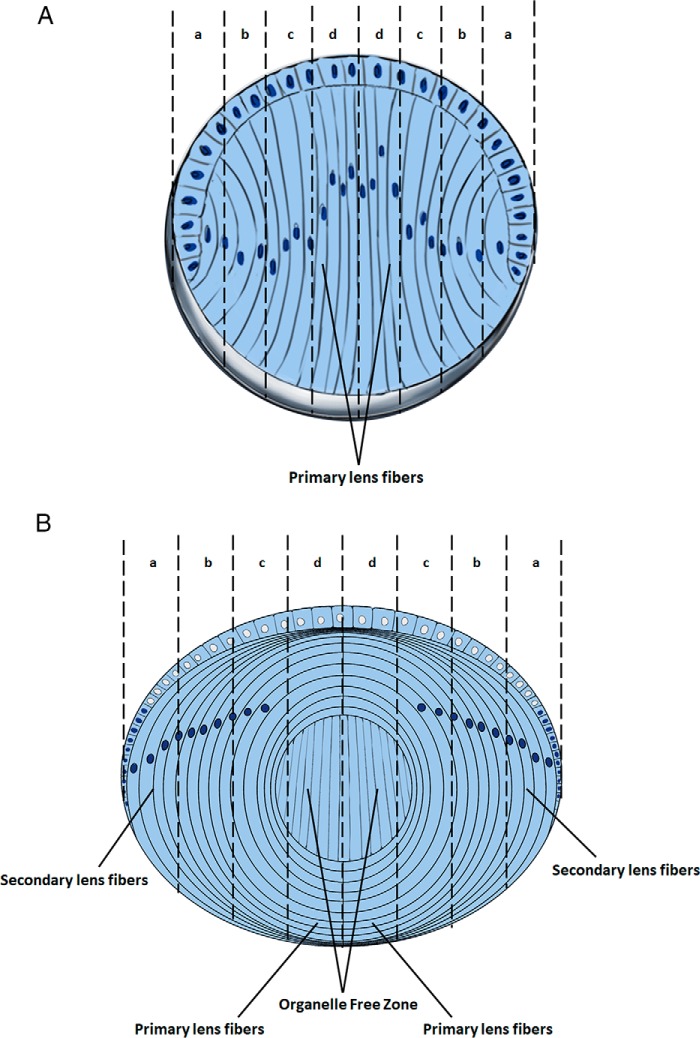
The identification and characterization of patterns of transcriptional bursting during cellular differentiation would be greatly facilitated by studying a tissue in which the temporal order and stage of differentiation within the tissue are easily determined. The mammalian ocular lens is composed of two compartments: the anterior lens epithelium and the “posterior” bulk of the lens formed by highly elongated lens fibers. During embryogenesis, a polarized hollow lens vesicle is formed (mouse E11.5 embryos), and its anterior part forms the epithelium, and the posterior part differentiates into the primary fiber cells (E11.5–14.5, Fig. 1A). Lens fibers in early differentiation are located in the outer shells of cells whereas each row of the cells toward the center of the lens represents more advanced stages of fiber cell differentiation (Fig. 1) (21–23). Subsequently, secondary lens fibers are added from lens epithelial cells located at the equatorial region to drive lens growth. Differentiating lens cells extend their length a thousand-fold (23). The main transcriptional output of the lens fiber cells consists of multiple crystallin genes, classified into α-, β-, and γ-crystallin families (24). Expression of the majority of crystallin genes increases within 2 or more orders of magnitude between lens epithelium and fibers measured as steady-state RNA levels by RNA-seq (25). Ultimately, the crystallins reach as much as ∼450 mg/ml total protein concentration in the central fiber cell cytoplasm (23). Crystallin gene loci display high abundance of RNA polymerase II within their coding regions and 3′-UTRs by ChIP-seq in lens chromatin (25). The use of RNA FISH in the lens can allow visualization of transcriptional dynamics of individual crystallin genes and aid in understanding how gene transcription is regulated during cellular differentiation at the single-cell level.
Figure 1.
Stages of lens fiber cell differentiation. A, diagrammatic summary of E12.5–E14.5 lens and progressive stages of lens fiber cell differentiation (early, intermediate, advanced, and terminally pre- and denucleated indicated by letters a, b, c, and d, respectively). The E14.5 lens is composed of the undifferentiated anterior epithelium and primary lens fibers. The inner lens fiber cell layers represent more differentiated cell. B, diagrammatic summary of E16.5–P1 lens and progressive stages of lens fiber cell differentiation (early, intermediate, advanced, and terminally pre- and denucleated organelle free zone, indicated by letters a, b, c, and d, respectively). The newborn lens contains the primary lens fiber cells in its core, whereas new secondary lens fibers are added, and the lens continue to grow throughout the life span.
To prevent light scattering, lens fiber cell terminal differentiation also includes tightly regulated degradation of subcellular organelles, including the mitochondria, endoplasmic reticulum, Golgi apparatus, and nuclei (26, 27). Degradation of nuclei terminates transcription. Thus, during a narrow window of time, lens fiber cell transcription has to meet various demands of the system prior its cessation. For example, between E11.5 and E14.5 of mouse embryonic development, the elongating primary lens fibers reach the anterior cells of the lens vesicle. The organelle free zone (OFZ) in the lens center, i.e. original primary lens fiber compartment (Fig. 1B), is formed between E16.5 and E18.5 (26). The newborn lens (P1) is composed from all different stages of lens fibers cells, i.e. early, intermediate, advanced, and terminally (pre- and denucleated) differentiated cells (Fig. 1B). The cellular and molecular mechanisms underlying formation of the OFZ remain poorly understood; nevertheless, phosphorylation of nuclear lamin A/C by Cdk1 regulated by Cdkn1b (p27) is involved (28, 29). During denucleation, the elongated “ovoid-like” lens fiber cell nuclei first change their shape into a more sphere-like structure, and with continuous chromatin condensation their size is gradually reduced, followed by abrupt disintegration of the nuclei into multiple apoptotic-like particles (30, 31). Lens fiber cell denucleation can be blocked by mutations in a group of genes; for example, the ATP-dependent chromatin–remodeling enzyme Snf2h (Smarca5) is required for this process through regulation of transcription factor Hsf4 and its target the Dnase2b gene (32), which encodes a lysosomal enzyme that degrades lens nuclear DNA (33). In other systems, Snf2h regulates a variety of nuclear processes, including assembly and sliding of nucleosomes along the DNA strand, and has known functions as a positive or negative regulators in RNA polymerase II transcription (34–37).
Here, we examined β-actin, αA-, βB1-, and γA-crystallin nascent transcription and determined transcriptional bursting parameters during lens differentiation. Transcription of β-actin is developmentally regulated in lens. We found that highly condensed nuclei just prior their destruction still transcribe γA- and βB1- but not αA-crystallin gene. Transcription of the crystallins is mostly regulated by burst fraction and is spatially regulated. Analysis of nuclear condensation shows transfer of the nuclear materials through the porous nuclear membrane prior to the final nuclear disintegration.
Results
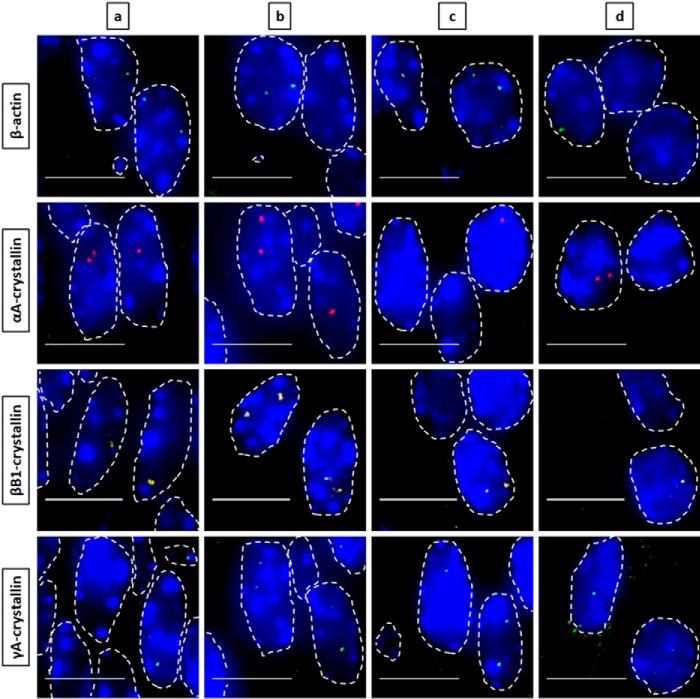
To establish RNA FISH in the mouse lens (Figs. 2–5), we first developed multiple sets of exon-specific 20-mer oligonucleotide probes that allow detection of nascent transcripts and adjusted the hybridization conditions for lens tissue sections. Diagrams of chromosomal localization of β-actin and crystallin genes and fluorescent labels are shown in Fig. S1. Under these conditions, expressions of the genes of interest were visualized as one or two transcription sites per individual nuclei as shown in newborn (P1) lens (Fig. 2). In early differentiating lens fiber cells that have just exited the cell cycle, zero, one, or two TSs, are detected for individual β-actin, αA-crystallin, and βB1-crystallin genes (Fig. 2). Expression of γA-crystallin was also detected in the nuclei of more differentiated cells. Use of exon- and intron-specific probes recognizing αA-crystallin mRNAs yielded spatial co-localization of both signals (Fig. S2), consistent with earlier studies demonstrating that these signals represent individual TSs (38, 39). Importantly, these TSs co-localize with RNA polymerase II foci detected by immunofluorescence as shown for all genes examined (Figs. S3–S6). As expected, nascent transcription of β-actin and αA-crystallin but not of βB1- and γA-crystallins was also found in lens epithelium (Fig. S7). Among these four genes, nascent transcription of αA-crystallin was first reduced during lens fiber differentiation prior to any major changes in nuclear morphology even though the condensed nuclei just outside of the OFZ express other genes, including β-actin, βB1-crystallin, and γA-crystallin. These studies establish the temporal and spatial order of αA- and βB1-crystallin transcription initiation before that of γA-crystallin in differentiating lens fibers and demonstrate transcriptional competence of structurally reorganized nuclei approaching their destruction.
Figure 2.
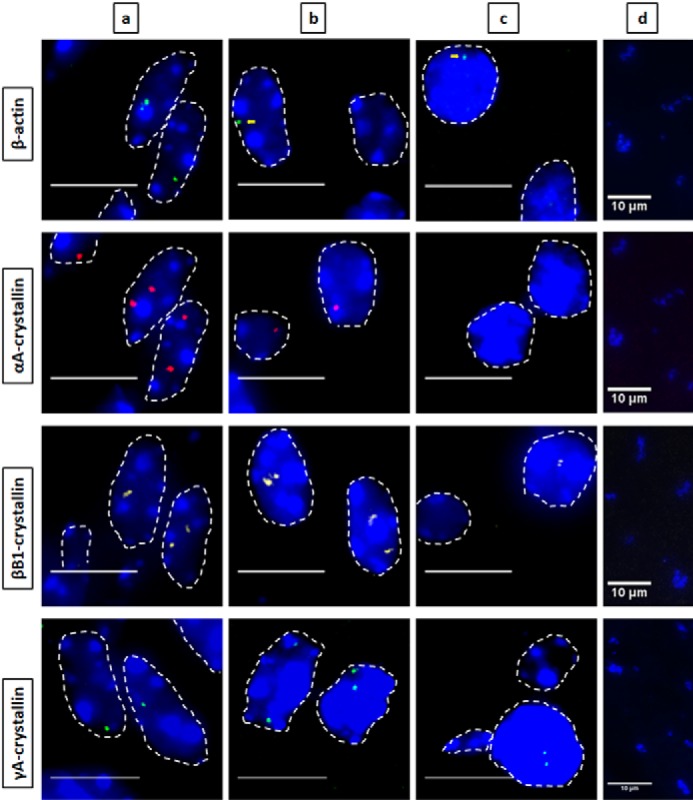
Nascent transcription sites of various genes during newborn mouse lens fiber cell differentiation show different spatial patterns of transcription for each gene. RNA FISH was performed to show nascent transcription sites of β-actin (Quasar 670, green), αA- (Quasar 570, red), βB1- (Cal Fluor Red 610, yellow), and γA-crystallin (Quasar 670, green) genes at various regions of differentiation in the newborn (P1) mouse lens fiber cells. The areas analyzed are shown in Fig. 1. Regions a, b, and c indicate progressive stages of differentiation throughout the lens tissue with region a being the least differentiated and region c being the most highly differentiated. Region d in this stage of lens development is where denucleation has occurred, and thus, there are no intact nuclei in this region, only degraded pyknotic nuclear remnants. Nuclei were stained by DAPI (blue) and outlined by dotted white lines. A few of the signals are indicated by yellow arrows. Images of nuclei were magnified and adjusted for brightness for viewing this figure. Scale bar, 10 μm.
Figure 3.
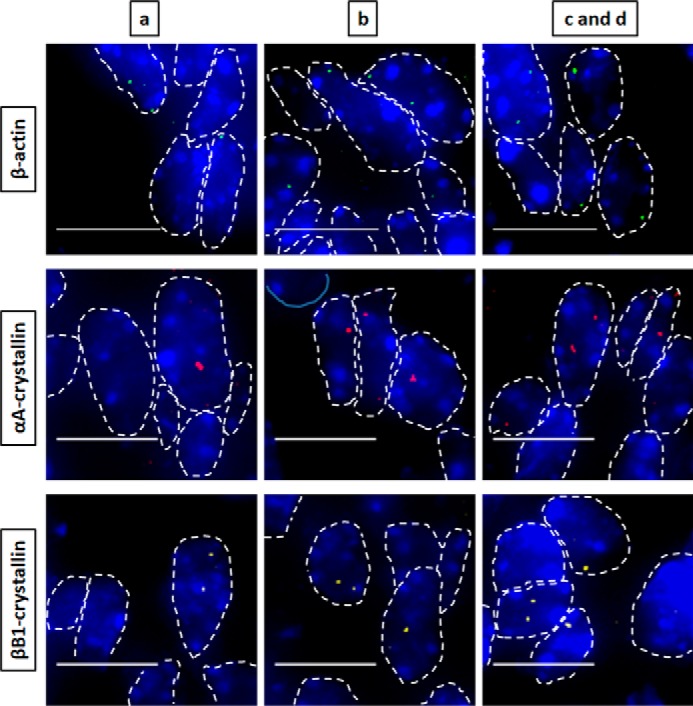
Nascent transcription sites of various genes at embryonic developmental stage E12.5 show different spatial patterns of transcription for each gene. RNA FISH was performed to show nascent transcription sites of β-actin, αA-, βB1-, and γA-crystallin genes in lens tissue regions a, b, c, and d of E12.5 mouse embryonic stage. The areas analyzed are shown in Fig. 1. Regions a, b, c, and d indicate progressive stages of differentiation throughout the lens tissue. Nuclei were stained by DAPI (blue) and outlined by dotted white lines. Areas c and d are shown as a combination at these earlier embryonic developmental stages because it better represents the future region that will eventually undergo denucleation in later developmental stages. Images of nuclei were magnified and adjusted for brightness/contrast for viewing for this figure. Scale bar, 10 μm.
Figure 4.
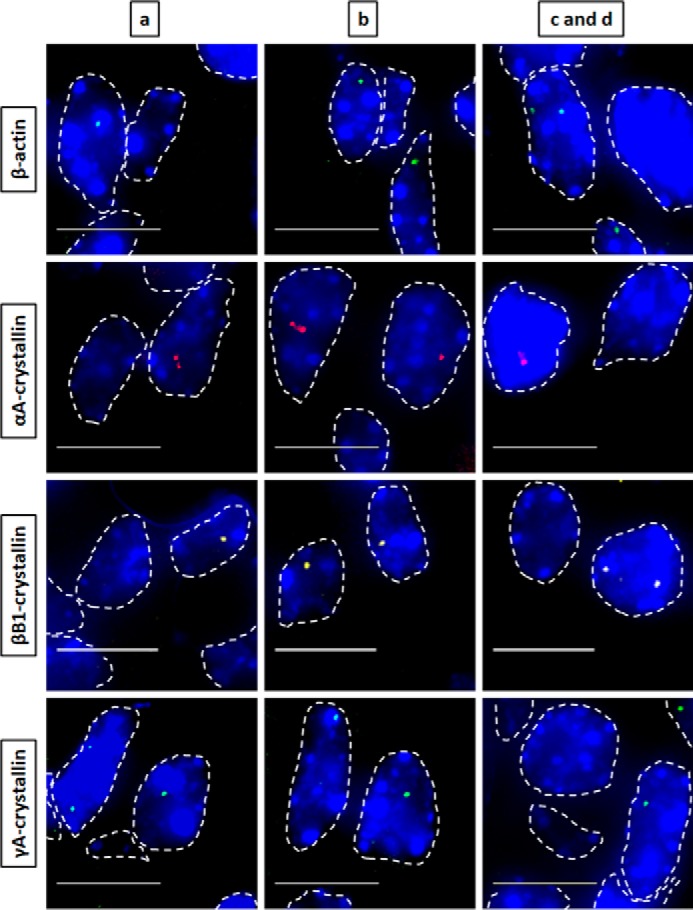
Nascent transcription sites of various genes at embryonic developmental stage E14.5 during mouse lens fiber cell differentiation show different spatial patterns of transcription for each gene. RNA FISH was performed to show nascent transcription sites of β-actin, αA-, βB1-, and γA-crystallin genes in lens tissue regions a, b, c, and d of E14.5 mouse embryonic stage. The areas analyzed are shown in Fig. 1. Regions a, b, c, and d indicate progressive stages of differentiation throughout the lens tissue. Nuclei were stained by DAPI (blue) and outlined by dotted white lines. Areas c and d are shown as a combination of one area at this earlier embryonic developmental stage because it better represents the future region that will eventually undergo denucleation in later developmental stages. Images of nuclei were magnified and adjusted for brightness/contrast for viewing for this figure. Scale bar, 10 μm.
Figure 5.
Nascent transcription sites of various genes at embryonic developmental stage E16.5 during mouse lens fiber cell differentiation show different spatial patterns of transcription for each gene. RNA FISH was performed to show nascent transcription sites of β-actin, αA-, βB1-, and γA-crystallin genes in lens tissue regions a, b, c, and d of E16.5 mouse embryonic stage. The areas analyzed are shown in Fig. 1. Regions a, b, c, and d indicate progressive stages of differentiation throughout the lens tissue. Nuclei was stained by DAPI (blue) and outlined by dotted white lines. Images of nuclei were magnified and adjusted for brightness/contrast for viewing for this figure. Scale bar, 10 μm.
To evaluate expression of β-actin, αA-, βB1-, and γA-crystallins during early stages of lens differentiation, we analyzed E12.5, E14.5, and E16.5 embryonic lenses (Figs. 3–5). Expression of β-actin is found across all developmental stages throughout the lens compartment. At E12.5, the early differentiating primary lens fibers first transcribe αA-crystallins followed by βB1-crystallins, but expression of the γA-crystallin is sparse (Fig. 3). At E14.5, transcription of γA-crystallin is abundant in early differentiating secondary lens fibers but delayed compared with the βB1-crystallin (Fig. 4). At E16.5, the innermost nuclei of the primary lens fibers already condense, and transcription of αA- but not βB1- and γA-crystallins is highly reduced (Fig. 5). Additional analysis of the RNA FISH data and RNA polymerase II shows that there is a notable reduction of RNA polymerase II signals with the progression of lens fiber cell differentiation (Fig. S3–S6). Interestingly, in lens fiber cell nuclei adjacent to the OFZ, the strongest polymerase signals match the nascent sites of the βB1- and γA-crystallin expression (Fig. S5–S6) indicating the possibility that these sites are “protected” from the bulk chromatin condensation effects associated with the denucleation process. Taken together, these studies show that patterns of nascent crystallin transcription (αA-crystallin transcription preceding βB1-crystallin transcription followed by γA-crystallin transcription) identified between E12.5 and E14.5 to form the primary fiber cell mass are comparable with those established above in differentiating secondary lens fibers in newborn lens.
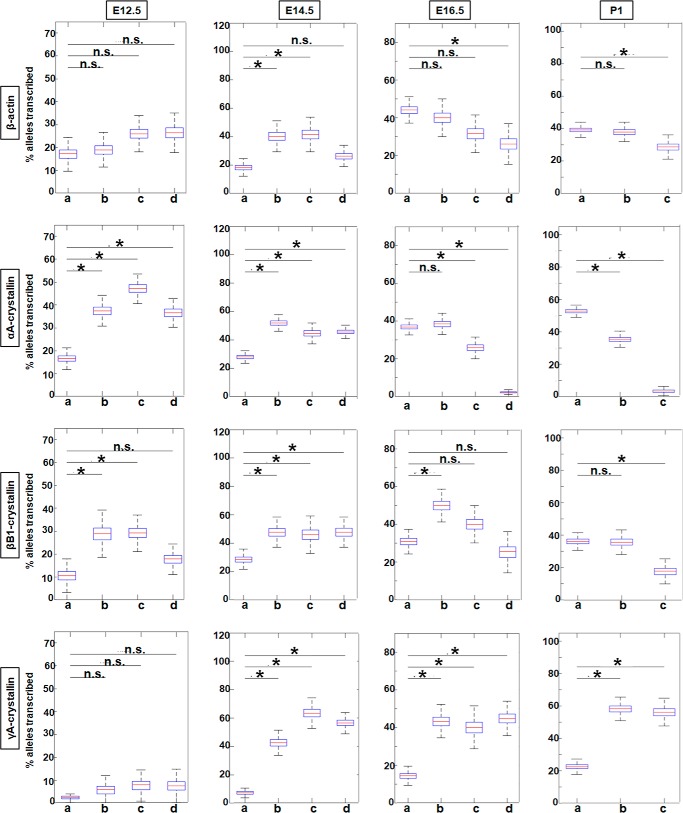
To evaluate transcriptional burst fractions of these individual genes during lens differentiation, we examined E12.5, E14.5, E16.5, and P1 lenses. Burst fractions were quantified as the percentage of transcribing alleles (Fig. 6) in each of the designated areas, a, b, c, and d, i.e. from the periphery to the center of the lens (Fig. 1). The data are displayed as box plots, which include median values. The numbers of nuclei analyzed for each lens area are summarized in Tables S2 and S3. Although it appears that the β-actin burst fraction may be developmentally regulated, at E14.5 the burst fraction for β-actin is significantly higher for areas b and c versus area a; however, the changes in the later stages of development, E16.5 and P1, are not statistically significant between areas a and b. At developmental stages E12.5 and E14.5, there is a significant 2- and 3-fold increase in αA- and βB1-crystallin transcriptional burst fraction, respectively, from area a to area b followed by a decrease from area b to areas c and d (Fig. 6). γA-crystallin is rarely expressed at E12.5, but at E14.5 there is a 9-fold increase in the transcription burst fraction of this gene from area a to area d. At the later stages of lens development (E16.5 and P1), the transcriptional burst fraction of αA-crystallin starts to significantly decrease from area a to area c and/or d by a factor of 9.8- and a 13.5-fold at E16.5 and P1, respectively (Fig. 6). βB1-crystallin burst fraction shows a similar decreasing pattern as that of αA-crystallin from area a to area c and/or d in the E16.5 and P1 stages of development within a 1.8–2-fold range of decrease between the areas compared at both stages. In contrast, the γA-crystallin transcriptional burst fraction at the E16.5 and P1 stages of development shows an overall 3-fold increase from area a to area c/d at both these stages (Fig. 6).
Figure 6.
Quantification of transcriptional burst fraction of the β-actin, αA-, βB1-, and γA-crystallin gene throughout mouse lens development and differentiation show varying patterns of transcriptional bursting for each gene. Transcription burst fraction is represented as percent alleles transcribed from total number of nuclei within each lens tissue region a, b, c or d at various mouse embryonic and newborn developmental stages. * denotes significance with p value ≤0.05; n.s. indicates not significant. Numbers of nuclei analyzed are given in Table S1. Standard deviations of these measurements are given in Table S3.
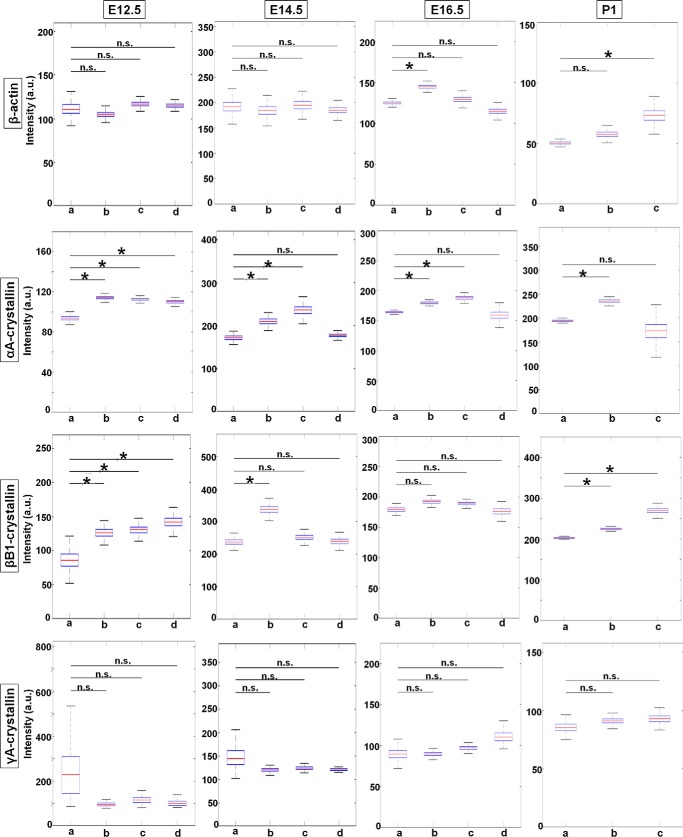
To analyze burst size, we directly quantified the normalized fluorescence intensities of nascent TS of the four indicated genes. The results are shown as box plots with median values (Fig. 7). At E12.5, the transcriptional intensity of the β-actin gene in each of the four compartments of the differentiating fiber cells (areas a–d), the median intensity, as well as range of maximal and minimal values appear stable with no significant spatial changes. Although γA-crystallin gene is rarely expressed at this stage, the few transcription sites that do appear do not show any significant change in transcriptional intensity between the different fiber compartments similar to β-actin nascent transcription. In contrast, the intensities of αA- and βB1-crystallin transcription increase about 1.2- and 1.6-fold at the E12.5 stage of differentiation, respectively. At E14.5, transcriptional intensity of β-actin, αA-, βB1-, and γA-crystallin genes increases in the range of 1.1–1.3-fold between the lowest and maximal median intensity values; the increase for αA- and βB1-crystallin is statistically significant. At E16.5, although there is some variability between the median intensities for β-actin, there is an overall trend of relatively “stable” nascent transcription across all four regions of differentiating lens fiber cells. For the γA- and βB1-crystallin genes, there is a nonsignificant 1.1–1.2-fold transcriptional intensity increase from differentiation areas a–d. Thus, βB1- and γA-crystallin gene shows a rather stable pattern of median intensities from early fibers to advanced fibers preparing for denucleation. In contrast, αA-crystallin gene shows a moderate but significant increase in the pattern of median intensities from early fibers to fibers preparing for denucleation, from area a to area c. In P1 lens, representing all stages of differentiation, β-actin median intensity shows a moderate but significant increase from early fibers to fibers preparing for denucleation. The αA-crystallin displays a maximum of intensity in intermediate secondary lens fibers (area b). βB1-crystallin displays notable increases of transcriptional intensity as cells differentiate, but no significant change is seen for γA-crystallin.
Figure 7.
Transcriptional intensities of β-actin, αA-, βB1-, and γA-crystallin genes at mouse embryonic developmental stages E12.5, E14.5, E16.5, and newborn P1 lens during lens cell differentiation show varying transcriptional bursting patterns for each gene. Representative experiments show mean fluorescence intensities of nascent transcription sites of the four indicated genes at the indicated mouse developmental stages within each of the indicated lens tissue areas. Data are shown as box plots to show the distribution. * denotes significance with p value ≤0.05; n.s. indicates not significant; a.u. denotes arbitrary units. Number of TSs analyzed is shown in Table S2. Standard deviations of these measurements are given in Table S4.
Combined together, these studies show that nascent transcription during lens differentiation is regulated by both transcriptional burst fraction and intensity. The burst fraction appears as the major factor driving changes in gene expression of each crystallin gene as well as that of β-actin expression in lens fiber cells. For example, there is as high as 3–9-fold increases of burst fractions for αA-, βB1-, and γA-crystallins when the lowest and highest % of transcribed alleles are compared (Fig. 6). The intensity of transcription can also change as much as 1.6-fold (namely in the βB1-crystallin at E12.5), but transcription intensity changes are most frequently in the range of 1.2–1.3-fold increase (Fig. 7).
Although the current model of denucleation during lens fiber cell differentiation is linked to Cdk1-catalyzed phosphorylation of lamin A/C (28), the changes in nuclear shape, size, and chromatin compaction detected here and in earlier studies suggest that there are additional processes that occur inside of the nuclei. Interestingly, a recent study showed that enucleating red blood cells produce caspase-3–dependent nuclear openings and release nuclear proteins into the cytoplasm (29, 41). To address this release of proteins in lens fiber cell nuclei, we used a panel of antibodies that probe both the nuclear envelope and nuclear proteins of different sizes in newborn lenses. We first co-localized lamin B1 and histone H3 proteins and compared nuclear morphology and fluorescent intensities in the area of early lens fiber cell differentiation in region a and in the OFZ border in region c (Fig. 8). The nuclei just outside of the OFZ are rounded, and the overall staining for both proteins was reduced compared with the DAPI nuclear signal. Likewise, there are notable differences in the H3K27me3 constitutive heterochromatin staining throughout the OFZ border suggesting protein reduction. The punctae staining pattern of H3K27me3, which marks the inactive X chromosome, gets dispersed or disappears altogether in the rounded nuclei near the OFZ indicating opening of the nucleosome and heterochromatin structures. The post-translationally modified histone H2BK12Ac is a marker of apoptosis (42). Nuclear staining pattern of this apoptotic marker in the nuclei approaching degradation near the OFZ shows no reduction of expression; however, a change in the localization pattern from a homogeneous to a more specific location toward the periphery of the nuclei is observed. Given the size of H3 under 20 kDa, we next examined larger proteins, including ATP-dependent chromatin-remodeling enzymes Brg1 (Smarca4) and Snf2h (Smarca5) of 185 and 122 kDa, respectively, that form multiprotein complexes between 0.5 and 2 MDa size (43). We also found notable reduction of Snf2h nuclear staining and a slight reduction of Brg1 staining in the nuclei just outside of the OFZ (Fig. 8). We conclude that like red blood cells during chromatin condensation, lens fiber cell nuclei also release both histone and nonhistone proteins into the cytoplasm, and this release appears selective for certain proteins in both systems.
Figure 8.
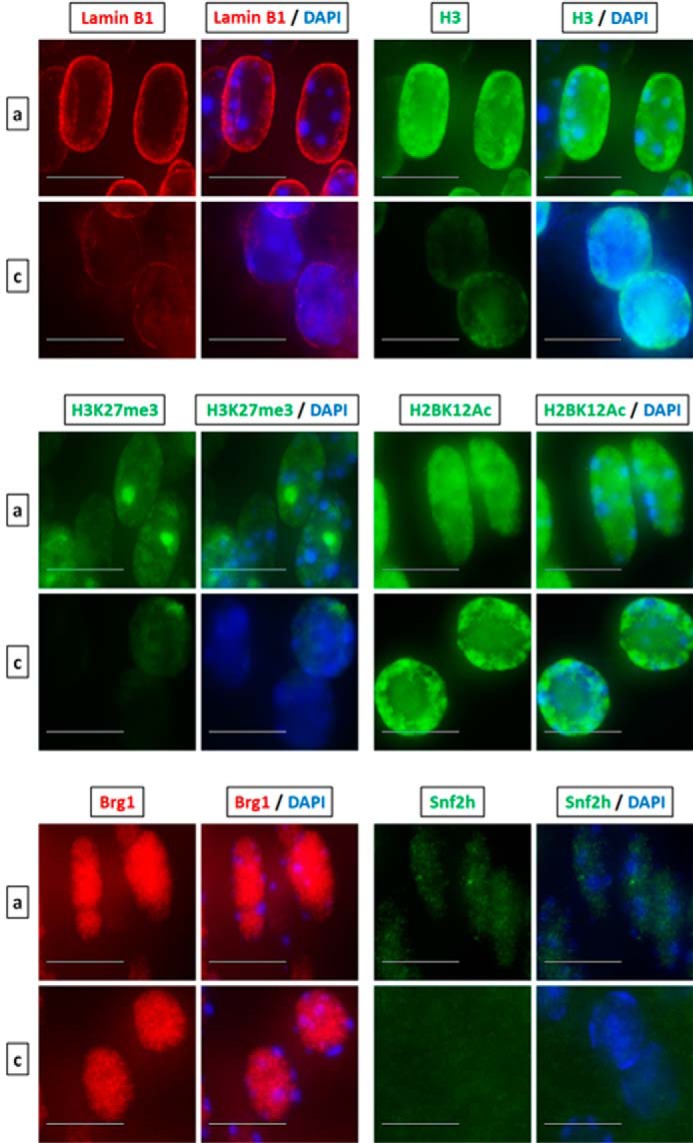
Denucleation of lens fiber cells is accompanied by nuclear condensation and transfer of nuclear proteins into the cytoplasm. Shown is immunofluorescence analysis of lamin B1, histone H3, H3K27me3, H2BK12Ac, Brg1, and Snf2h (Smarca5) in early differentiated lens fiber nuclei in region a versus terminally differentiated nuclei about to undergo denucleation in region c. The puncta staining pattern of H3K27me3 are sites of inactivated X-chromosome. Images of nuclei were magnified and adjusted for brightness for viewing for this figure. Scale bar, 10 μm.
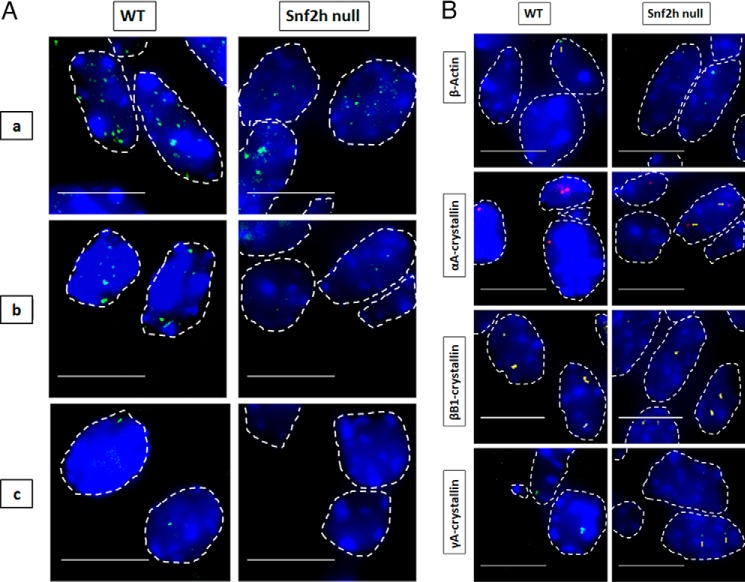
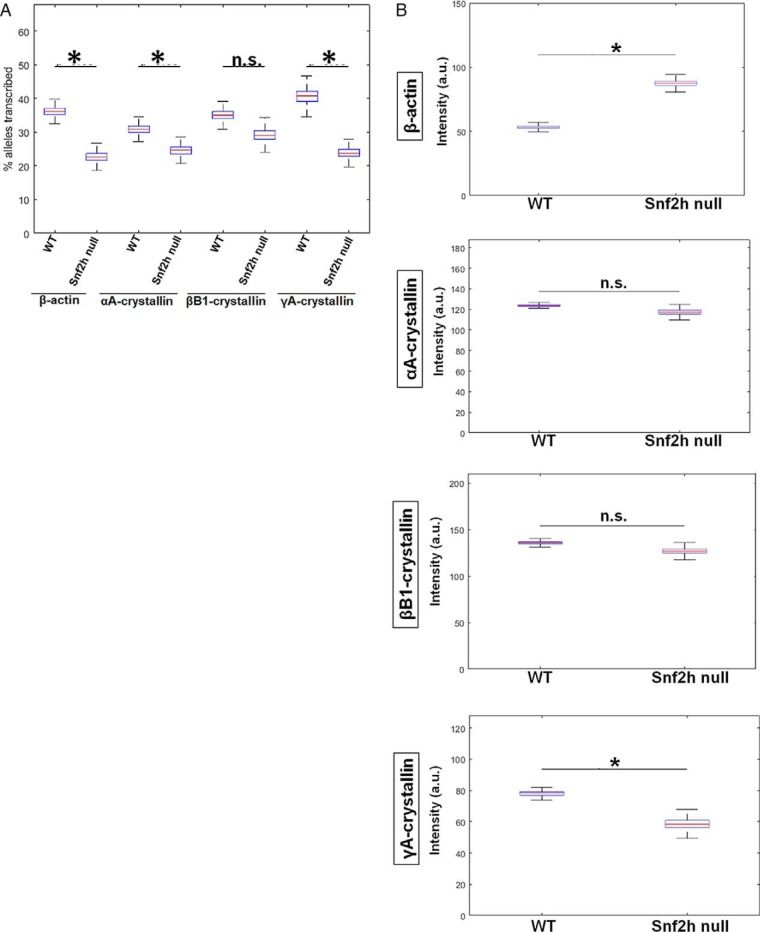
Lens fiber cell denucleation defects are found when genes encoding denucleation enzymes (Alox15, Cdk1, and Dnase2b), chromatin regulators (Brg1/Smarca4, Ncoa6, and Snf2h/Smarca5), DNA repair and related proteins (Ddb1, Nds1, and p53), or transcription factors (Foxe3, Gata3, Hsf4, and p53) are mutated (22). Previously, we found that depletion of the ATP-dependent chromatin-remodeling enzyme Snf2h results in formation of disorganized lens fiber cell mass, retention of their nuclei, and absence of the epithelium (32). As it is not known how any chromatin remodeler affects transcriptional bursting, we analyzed these parameters in Snf2h null lens fiber cell nuclei. It has been suggested that a trans-factor will affect transcription burst size (44), but it has never been shown directly in any mammalian tissue. Our data show that Snf2h-depleted nuclei also change their shape and size, form RNA polymerase II high-density areas (Fig. 9A), and retain expression of β-actin and crystallin genes (Fig. 9B). Depletion of Snf2h leads to a significant reduction of burst fraction of α- and γ-crystallin genes and of the β-actin gene but no significant reduction of the βB1-crystallin gene burst fraction (Fig. 10A). Within this group of four genes, a moderate but significant change in transcriptional intensity was found for β-actin and γA-crystallin gene but not for αA- and βB1-crystallin genes. There was a reduction in transcriptional intensity in γA-crystallin transcription (Fig. 10B). There may also be possible “compensatory” effects, i.e. reduction of burst fraction and increase in burst size, for β-actin.
Figure 9.
Visualization of nascent transcription in WT and Snf2h null lenses. A, visualization of RNA polymerase (green), which are areas of high active polymerase II density in nuclei of WT and Snf2h null lens. Sites of active RNA transcription shown by immunofluorescence of active RNA polymerase II in WT versus Snf2h null lens at various regions of the tissue show distinct differences toward the center of the lens where terminal differentiation normally occurs. RNA polymerase II punctae staining in WT lens include regions a, b, and c. Snf2h null lenses form disorganized lens fibers and lack the lens epithelium (31). B, representative RNA FISH images of the four indicated genes in newborn WT versus Snf2h null mouse lens. Nuclei were stained by DAPI (blue) and outlined by dotted white lines. A few of the signals are indicated by yellow arrows. Images of nuclei were magnified and adjusted for brightness for viewing for this figure. Numbers of nuclei analyzed are shown in Tables S1 and S2, and standard deviations of these measurements are shown in Tables S3 and S4. Scale bar, 10 μm.
Figure 10.
Analysis of transcriptional bursting parameters in nuclei following depletion of Snf2h in lens fiber cells shows distinct changes in transcriptional bursting parameters for each gene. A, quantification of transcription burst fraction as of β-actin, αA-, βB1-, and γA-crystallin genes in newborn WT versus Snf2h null mouse lens. The lens tissues in this experiment was not divided into areas a–d, but rather sets of nuclei were randomly chosen from all over the tissue due to the disorganized nature of the Snf2h null lens. Transcription burst fraction shown as percent alleles transcribed within the whole tissue of each gene, β-actin, αA-, βB1-, and γA-crystallin genes. B, transcriptional intensity measured by mean fluorescence intensities of nascent transcription sites of the four indicated genes from the whole newborn mouse lens tissue. * denotes significance with p value ≤0.05; n.s. indicates not significant; a.u. denotes arbitrary units. Numbers of nuclei analyzed are shown in Tables S1 and S2, and standard deviations of these measurements are shown in Tables S3 and S4.
Discussion
In this study, we examined both the onset and termination of nascent transcription of four genes encoding critical lens structural proteins in differentiating lens fibers and determined the dynamic range of transcriptional bursting parameters during normal cellular differentiation. We also probed these parameters following depletion of Snf2h that affects chromatin remodeling and DNA accessibility. These studies prompted us to reexamine cellular and molecular mechanisms of lens fiber cell denucleation. The crystallin genes investigated here rank among the most highly expressed genes in mammalian tissues. The present studies provide direct evidence that during cellular differentiation there are changes in both the burst fraction and burst intensity of these genes. Specifically, we found marked changes in the burst fraction of these crystallin genes, with more moderate changes in the burst intensity parameter. A summary model to show changes in transcriptional fraction and intensity between early and advanced lens fibers is shown in Fig. 11. Our data thus show that during cellular differentiation the transcriptional system can increase its fraction size within a 2–13-fold range scale whereas the transcriptional intensity, proportional to the number of RNA polymerase II molecules, operates rather within a narrow 1.1–1.6-fold range.
Figure 11.
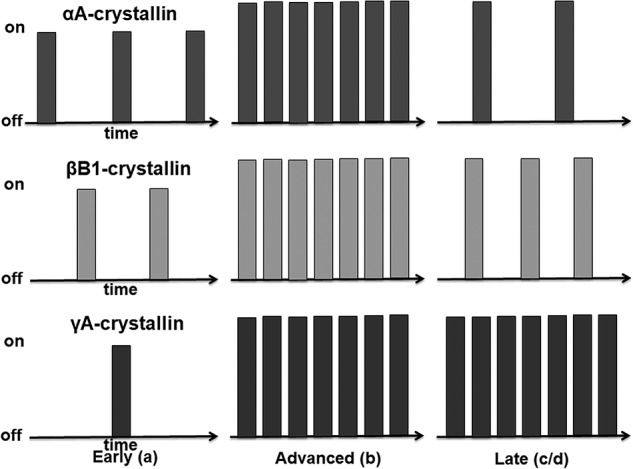
Summary models of transcriptional bursting during lens fiber cell differentiation. Lens fiber cell differentiation is divided into three phases, including “early,” “advanced,” and “late” stages, that correspond to regions a, b, and c/d, respectively. The x axis represents time, and the y axis represents transcriptional status “on” and “off.” Each bar represents one transcriptional burst event. Each crystallin gene studied, Cryaa, Crybb1, and Cryga, employs both bursting parameters, although transcriptional fraction prevails over the transcriptional burst size. In the early lens fibers, transcriptional burst fraction of these crystallins follows the Cryaa > Crybb1 > Cryga pattern. In the advanced lens fibers, transcriptional fraction increases significantly for each of these genes, whereas transcriptional size increases only moderately. In the late lens fibers, expression of Cryaa is attenuated; expression of Crybb1 is moderately attenuated, and expression of Cryga is maintained at “maximal” levels despite the ongoing nuclear condensation, transfer out of nuclear proteins, and denucleation.
Despite the nuclear degradation process and accompanying subnuclear changes, such as chromatin condensation, transcription of multiple genes is resistant to these processes and can be maintained just prior to the physical disintegration of the condensed nuclei. Our study thus implicates novel mechanisms to preserve active transcription of specific loci despite the ongoing nuclear disintegration processes.
Quantitative studies of transcriptional bursting parameters were previously conducted with βA-globin in red blood cells (17), eight genes, including β-actin in liver (11), a few other genes in cell lines, and several primary tissues (6, 45, 46). Recently, RNA FISH was combined with single-cell RNA-seq to determine zones of gene expression within distinct subregions (hexagon-shaped “lobules”) of mouse liver (12). Although this is an in vivo system to study cellular differentiation, the present lens model offers a clear record of the differentiation processes. Steady-state levels of globin and crystallin mRNAs, expressed in erythrocytes and lens fibers, respectively, are comparable, and their genes are marked by high RNA polymerase II occupancy over both crystallin (25) and globin loci (47, 48), indirectly supporting the concept of RNA polymerase II convoys (8). In this study, we have analyzed transcriptional bursting parameters in vivo during the highly temporally and spatially ordered process of lens development. Our findings demonstrate that differentiation is predominantly regulated at the level of burst fraction (Fig. 11).
Any biological system operates under resource constraints resulting in discontinuities. Transcriptional bursting has already been linked to cellular economy and resource sharing (50). Even if the transcription in lens fiber cells is additionally limited by the nuclear degradation, our data show dynamic changes mostly in burst fraction. This may reflect the fact that the other parameter, the burst intensity, operates within a 1.3-fold scale reflecting the mechanisms how RNA polymerase convoys function (8, 9). Thus, if mRNA synthesis needs to be highly increased like in differentiating lens fiber cells, the transcriptional machinery has to operate using the burst fraction parameter. The current data support this model.
The present data show that nascent transcription of β-actin is developmentally regulated in lens (Figs. 6 and 7). Among the four genes examined here, the γA- and αA-crystallins show the highest change in burst fraction (Fig. 6, E14.5, E16.5, and P1 stages) and intensity/size (Fig. 7, E12.5 and E14.5 stages), respectively. Two differentiation-regulated distal enhancers reside within the 16-kbp mouse Cryaa locus (51, 52). In contrast, the individual β- or γ-crystallin genes are regulated via 5′-extended promoters (53, 54). Furthermore, genome-wide analysis of H3K4me1 and H3K27ac histone post-translational modifications in lens chromatin (55) as reliable predictors of enhancers (15) does not show any candidate distal enhancer for β/γ-crystallin genes. Our data thus show that independently of the organization of the essential crystallin cis-acting regions of transcription, nascent transcription is predominantly regulated by transcriptional burst fraction.
The transcriptional burst size is related to the number of RNA polymerase molecules engaged in the transcription process (17). The present data show that lens fiber cell cellular differentiation mostly operates within a 1.3-fold range of transcriptional intensity/size and a 2–13-fold range of burst fraction.
To interrogate the influence of chromatin remodeling on bursting parameters, Snf2h-depleted lenses were analyzed in detail. Analysis of the ATP-dependent chromatin remodeling enzyme Snf2h loss-of-function lens model shows that the burst fraction of the αA- and γA-crystallin genes was affected but not of the βB1-crystallin. Burst intensity of only β-actin and γΑ-crystallin genes was affected. We propose that chromatin remodelers contribute to the burst intensity possibly by affecting DNA accessibility thus influencing transcriptional machinery occupancy, enabling changes in histone modifications and altering RNA polymerase density at specific regulatory regions. Earlier findings demonstrated that Snf2h binds to the Cryaa locus at the promoter region, and it has a direct role in transcription in cytokine gene expression in T cells of the immune system (37, 51). Snf2h can stabilize both an active or repressed transcriptional state (56, 57). As Snf2h proteins are transferred out of nuclei prior to denucleation, reduction of nuclear Snf2h during the denucleation process could explain why cessation of nascent αA-crystallin transcription is found in advanced lens fibers.
Lens fiber cell denucleation could impose restrictions on transcription; however, our data show transcriptional competence of nuclei as they approach the time of their destruction. The RNA polymerase II-containing foci reduce their abundance as the lens fiber cell nuclei condense their chromatin and reduce their size in the preparation for their destruction. In three denucleating cell types, i.e. erythrocytes, lens fibers, and skin keratinocytes, the cells employ various common and distinct mechanisms. In maturing erythrocytes (proerythroblasts), it has been recently shown that the nuclei form caspase 3-dependent openings in the lamin B nuclear envelope through which histones exit the nuclei into the cytoplasm (41), and the orthochromatic nuclei are ultimately degraded outside the cell (enucleated) by macrophages (58). The keratinocytes degrade their nuclei via the apoptosis-distinct “cornification” process (59), through lamin A/C disruption, and removal of the nucleus by nucleophagy (60), whereas chromosomal DNA is degraded by neutral DNase 1L2 (61). In contrast, lens-specific acid DNase IIβ stored within lysosomes is needed for DNA degradation in lens fibers (33), although normal OFZs are found in both caspase-3 and caspase-3/6 null lenses (62). Based on the structural analysis of degrading keratinocyte nuclei, it has been proposed that transcription within these nuclei is terminated (63); however, our data show continuing expression of selected genes even in highly condensed lens fiber cell nuclei. The present findings show that histones and other proteins leave the lens fiber cell nuclei during their nuclear compaction. In lens, earlier studies have shown that Cdk1 phosphorylates lamins A/C to facilitate the denucleation process (28, 29), and this may induce structural changes of the nuclear Lamina needed for the early exit of proteins. Our findings show that lens fiber cell nuclei evolved internal nuclear reorganization processes to preserve transcription of specific genes and suggest early release of specific nuclear proteins into the cytoplasm while retaining others such as Brg1.
Interestingly, lens-abundant αA- and αB-crystallins and beaded filament structural protein 2 (Bfsp2) were also found in the nuclei (43, 64–67) raising the possibility that these “late” nuclear openings are permissive for a bidirectional traffic of proteins. Additional mechanisms involve interactions of α-crystallins with single-stranded regions of the γ-crystallin genes located between the start site of transcription and ATG to augment their expression (64, 68), and αA-crystallin can bind to histones H2B and H4 (67). It is possible that an influx of cytoplasmic lens fiber proteins may target and protect the transcriptionally active regions during the last stages of terminal differentiation. The αA-crystallin, or perhaps HSP27, may be just such a lens fiber cytoplasmic protein with chaperone potential (65, 69). Use of fusion proteins expressed in the transgenic lens, including different fluorescent proteins, in combination with the MS2-binding site for RNA detection (70) will be needed to further probe both the transcriptional processes and denucleation cascade taking full advantage of lens transparency and ordered differentiation of the lens fibers.
Materials and methods
Antibodies
Primary antibodies used for immunofluorescence alone and immunofluorescence combined with RNA FISH were anti-RNA polymerase II phospho-Ser-5 (Abcam, ab5131, 1:800), anti-H3K4me3 (Millipore, 07-473, 1:1000), anti-H3K27me3 (Millipore, 07-449, 1:250), anti-H2BK12ac (Abcam, ab61228, 1:100), anti-Brg1 (Santa Cruz Biotechnology, sc-17796, 1:200), anti-lamin B1 (Santa Cruz Biotechnology, sc-374015, 1:100), and anti-histone H3 (Abcam, ab1791, 1:300).
Mice and tissue
Animal husbandry and experiments were conducted in accordance with the approved protocol of the Albert Einstein College of Medicine Animal Institute Committee and the ARVO Statement for the Use of Animals in Ophthalmic and Vision Research. Noon of the day the vaginal plug was examined was considered as E0.5 of embryogenesis. Individual lenses were harvested from newborn FVB mice. Animals were euthanized by CO2, and mouse embryos were dissected from pregnant females. In some cases, whole eyeballs were removed from the postnatal animals. Tissues were then fixed in 4% paraformaldehyde at 4 °C, submerged in 30% sucrose overnight at 4 °C, and embedded in OCT. Serial sections were cut in 7-μm thickness through the mid-section of the lens and then used for hybridizations. A procedure to generate floxed Snf2h model and conditional inactivation in the lens is described elsewhere (32, 51). For all embryonic mouse studies, the embryos were removed from the womb, flushed, and fixed in 4% paraformaldehyde overnight at 4 °C, then incubated overnight with 30% sucrose at 4 °C, and then embedded in OCT before cryosectioning. All animals were sacrificed at approximately the same time of day to remove any circadian rhythm influence on transcriptional activity.
RNA FISH hybridizations and imaging
Probe libraries were designed and constructed using the software tool provided by Biosearch Technologies. Each probe was verified for specificity through the BLAST search at the NCBI. Most libraries consisted of 12–48 probes of length 20 nucleotides, complementary to the coding sequence of each gene (Fig. S1B). Hybridizations were done overnight with three differentially labeled probes using Quasar 570, Quasar 670, and CAL FLUOR Red 610 fluorophores. For immunofluorescence, an Alexa Fluor 488-conjugated secondary antibody (ThermoFisher Scientific) for RNA polymerase II was added to the hybridization mix and used for protein immunofluorescence. DAPI for nuclear staining was added during the washes. Tissue sections were placed in a 1× Decloaking buffer (10× Reveal Decloaking buffer, Biocare Medical) used as an antigen-retrieval agent and underwent a series of heat and pressure treatments in a decloaker. The decloaking procedure involved heating the tissue at 125 °C for 30 s at a pressure of 18–24 p.s.i. and then 90 °C for 10 s. After 5 min of cooling at room temperature followed by two washes in tap water and one in PBS, the sections were further processed through successive treatments to reduce autofluorescence: 0.25% ammonia to 70% alcohol for 20 min at room temperature, followed by 0.5% sodium borohydride for 50 min at 4 °C. After rinsing with deionized water and then PBS, the sections were subject to 5 mm magnesium chloride treatment for 10 min. Pre-hybridization was performed at 37 °C in 20% formamide, 2× SSC for 1 h followed by hybridization with 125 nm of probe overnight at 37 °C in a humidified chamber in the dark. Post-hybridization washes were conducted at room temperature in the dark as follows: 20% formamide, 2× SSC for 15 min, 20% formamide, 2× SSC, 10 μg/ml DAPI for 15 min. All percentage concentrations were v/v. After a brief wash with PBS, the slides were mounted with Antifade (Molecular Probes). Samples were then mounted with 1-mm-thick glass coverslips and then imaged. Images were taken with either a Carl Zeiss inverted fluorescence microscope or Olympus DS6 microscope equipped with a ×100 and ×63 oil-immersion objectives. Quantification was done on stacks of 41 optical sections with Z spacing of 0.2 μm (66, 70).
RNA FISH with immunofluorescence
RNA FISH combined with immunofluorescence was adapted from a previously published study (40, 68). The procedure followed the same steps as the RNA FISH method up to the pre-hybridization step. But during pre-hybridization, an additional RNase inhibitor, Superase Inhibitor, at 10 units/ml was added to prevent RNA degradation by RNases often found in many antibody solutions. During the hybridization step, this RNase inhibitor was added again along with the primary antibody and the fluorescent tagged DNA probes against the target mRNAs. As with RNA FISH, hybridization was done overnight at 37 °C, and the slides were then washed and treated with secondary antibody for 1 h at 37 °C. After treatment with secondary antibody, the wash step and DAPI treatment were the same as in the RNA FISH method.
Immunofluorescence
For immunofluorescence, the procedure followed the same steps as the RNA FISH up to the pre-hybridization step. After the autofluorescence treatment was complete, slides were washed with TBS plus 0.025% Triton X-100, blocked in 1% BSA for 1 h at room temperature, and then incubated overnight at 4 °C in a humidified chamber. The next day, slides were washed again in TBS plus 0.025% Triton X-100 incubated with fluorophore-conjugated secondary antibody for 1 h at room temperature and then washed and mounted with a DAPI-containing mounting media (Vectashield).
Imaging and image analysis
Three-dimensional image data were acquired using the Zeiss Axio Observer CLEM microscope (Carl Zeiss) with a Zeiss AxioCam MRm Black/White camera using Axiovision Software or the Olympus DS6 microscope (Olympus) with a Sensicam QE cooled CCD camera (Black/White) using IP Lab 4.0.8 software. ×10 1.0 NA and ×60 1.4 NA objectives were used and filters for DAPI, FITC, Cy3, and Cy5. Slides were evaluated at ×10 magnification to review overall section quality and to scale the total size of the lens tissue and at ×60 for the distribution of the fluorescence signal (nascent transcription sites). All 41 image z-stacks were compressed into one image using Maximum Projection in ImageJ. Only sites within nuclei were counted. The number of nuclei in each field examined was also counted, including those within designated regions where transcription sites were not detected, to determine the relative frequency of occurrence of nascent transcription events. Transcription sites were detected with Volocity software that analyzed merged images with the specific probes against the gene of interest and DAPI for detection of nuclei. Transcription sites were automatically detected only inside the nuclei using Volocity software. Bleed-through of transcript signal between channels was minimal. Tissue segmentation was carried out manually on a maximal projection of the DAPI channel. All 41 image z-stacks were compressed into one image using Maximum Projection. Images were then deconvoluted in Volocity prior to any measurements. Only sites within nuclei were counted where nuclei were manually selected using the “Freehand ROI” tool. Merged images were analyzed with the specific probes against the gene of interest and DAPI for detection of nuclei. Dots were automatically detected inside the nuclei using Volocity software's “Find Objects” task. Thresholding based on signal intensity, which uses Otsu's method on the histogram of intensities in the image, was used to separate signal from background. The threshold had to be modified each time for each of the different regions within the same tissue due to variable signal-to-background levels across the tissue. The “Mean Pixel Intensity” was used for quantifying and graphing the signal intensity values. The signal intensity values were graphed as box plots. The data collected from the Quasar 570, Quasar 670, and Cal Fluor Red 610 fluorescence channels corresponded to the dyes used to label the FISH oligonucleotide probes, and FITC was used to detect polymerase II protein. Neighboring tissues in the eye, such as the retina and cornea that express much lower amounts of crystallin genes compared with the lens, were also imaged as negative controls. The data collected in the DAPI channel provided the boundaries of nuclei in the specimen.
Quantitative analysis of burst fraction, graphical display of data, and statistical analysis
We performed a bootstrapping resampling analysis (49) to determine whether the observed burst fraction and burst intensity are significantly different between different stages of lens fiber cell differentiation. We quantified the number of active TS throughout mouse lens development and differentiation in a pool ranging from 70 to 521 cells and from 4 to 791 transcription sites (Tables S1 and S2). We then selected, for each gene, mouse development, and differentiation, 10,000 groups of cells and transcription sites containing the same number of cells and transcription sites (for example 195 for β-actin E14.5 in area a, Table S1) randomly picked from their groups. We calculate the burst fraction and burst intensity of each group and plotted the box plot (Figs. 6, 7, and 10, A and B).
To estimate whether two populations are significantly different, we calculated the 97.5 quantile of the lower value and compared it with the 2.5 quantile of the higher value. For example, during E14.5, the percent of β-actin transcribing in region “a” is significantly lower than the percent of β-actin transcribing in region “b” but not as the percent of β-actin transcribing in region “d” (p value < 0.05, Fig. 6). Spatial profile of the lens tissue was symmetrized between left and right, and the two sides were analyzed as technical replicates.
Author contributions
S. L., R. H. S., and A. C. conceptualization; S. L., M. L.-J., and P. G. data curation; S. L., P. G., and C. P. software; S. L., A. S., R. A. C., P. G., and C. P. formal analysis; S. L., A. I. S., and A. C. supervision; S. L., R. H. S., and A. C. funding acquisition; S. L. validation; S. L. and R. H. S. investigation; S. L. and C. P. visualization; S. L., A. S., R. A. C., M. L.-J., P. G., C. P., and A. I. S. methodology; S. L. and A. C. writing-original draft; S. L. project administration; S. L. and R. H. S. writing-review and editing; A. S., R. A. C., M. L.-J., R. H. S., and A. I. S. resources.
Supplementary Material
Acknowledgments
We thank Dr. Shalev Itzkovitz for the critical reading of the manuscript. We are grateful to Dr. Usha Andley for advice. We thank the Analytical Imaging core facility for their services. The imaging was conducted in the Analytical Imaging Facility, which is funded by National Institutes of Health Grant P30CA013330 from NCI.
This work was supported by National Institutes of Health Grants R01 EY014237 (to A. C.), U01 EB021236 (to R. H. S. and R. C.), R01 DK096266 (to A. I. S.), and T32 GM007491 (to S. L.). The authors declare that they have no conflicts of interest with the contents of this article. The content is solely the responsibility of the authors and does not necessarily represent the official views of the National Institutes of Health.
This article contains Figs. S1–S7 and Tables S1–S4.
- RNA FISH
- RNA fluorescent in situ hybridizations
- OFZ
- organelle free zone
- TS
- transcription site
- DAPI
- 4,6-diamidino-2-phenylindole dye
- -seq
- -sequencing.
References
- 1. Raj A., and van Oudenaarden A. (2008) Nature, nurture, or chance: stochastic gene expression and its consequences. Cell 135, 216–226 10.1016/j.cell.2008.09.050 [DOI] [PMC free article] [PubMed] [Google Scholar]
- 2. Hager G. L., McNally J. G., and Misteli T. (2009) Transcription dynamics. Mol. Cell 35, 741–753 10.1016/j.molcel.2009.09.005 [DOI] [PMC free article] [PubMed] [Google Scholar]
- 3. Coulon A., Chow C. C., Singer R. H., and Larson D. R. (2013) Eukaryotic transcriptional dynamics: from single molecules to cell populations. Nat. Rev. Genet. 14, 572–584 10.1038/nrg3484 [DOI] [PMC free article] [PubMed] [Google Scholar]
- 4. Levsky J. M., Shenoy S. M., Pezo R. C., and Singer R. H. (2002) Single-cell gene expression profiling. Science 297, 836–840 10.1126/science.1072241 [DOI] [PubMed] [Google Scholar]
- 5. Battich N., Stoeger T., and Pelkmans L. (2015) Control of transcript variability in single mammalian cells. Cell 163, 1596–1610 10.1016/j.cell.2015.11.018 [DOI] [PubMed] [Google Scholar]
- 6. Corrigan A. M., Tunnacliffe E., Cannon D., and Chubb J. R. (2016) A continuum model of transcriptional bursting. Elife 5, e13051 10.7554/eLife.13051 [DOI] [PMC free article] [PubMed] [Google Scholar]
- 7. Zenklusen D., Larson D. R., and Singer R. H. (2008) Single-RNA counting reveals alternative modes of gene expression in yeast. Nat. Struct. Mol. Biol. 15, 1263–1271 10.1038/nsmb.1514 [DOI] [PMC free article] [PubMed] [Google Scholar]
- 8. Tantale K., Mueller F., Kozulic-Pirher A., Lesne A., Victor J. M., Robert M. C., Capozi S., Chouaib R., Bäcker V., Mateos-Langerak J., Darzacq X., Zimmer C., Basyuk E., and Bertrand E. (2016) A single-molecule view of transcription reveals convoys of RNA polymerases and multi-scale bursting. Nat. Commun. 7, 12248 10.1038/ncomms12248 [DOI] [PMC free article] [PubMed] [Google Scholar]
- 9. Singh S. K., Qiao Z., Song L., Jani V., Rice W., Eng E., Coleman R. A., and Liu W. L. (2016) Structural visualization of the p53/RNA polymerase II assembly. Genes Dev. 30, 2527–2537 10.1101/gad.285692.116 [DOI] [PMC free article] [PubMed] [Google Scholar]
- 10. Vera M., Biswas J., Senecal A., Singer R. H., and Park H. Y. (2016) Single-cell and single-molecule analysis of gene expression regulation. Annu. Rev. Genet. 50, 267–291 10.1146/annurev-genet-120215-034854 [DOI] [PMC free article] [PubMed] [Google Scholar]
- 11. Bahar Halpern K., Tanami S., Landen S., Chapal M., Szlak L., Hutzler A., Nizhberg A., and Itzkovitz S. (2015) Bursty gene expression in the intact mammalian liver. Mol. Cell 58, 147–156 10.1016/j.molcel.2015.01.027 [DOI] [PMC free article] [PubMed] [Google Scholar]
- 12. Halpern K. B., Shenhav R., Matcovitch-Natan O., Toth B., Lemze D., Golan M., Massasa E. E., Baydatch S., Landen S., Moor A. E., Brandis A., Giladi A., Avihail A. S., David E., Amit I., and Itzkovitz S. (2017) Single-cell spatial reconstruction reveals global division of labour in the mammalian liver. Nature 542, 352–356 10.1038/nature21065 [DOI] [PMC free article] [PubMed] [Google Scholar]
- 13. Itzkovitz S., Blat I. C., Jacks T., Clevers H., and van Oudenaarden A. (2012) Optimality in the development of intestinal crypts. Cell 148, 608–619 10.1016/j.cell.2011.12.025 [DOI] [PMC free article] [PubMed] [Google Scholar]
- 14. Levine M., Cattoglio C., and Tjian R. (2014) Looping back to leap forward: transcription enters a new era. Cell 157, 13–25 10.1016/j.cell.2014.02.009 [DOI] [PMC free article] [PubMed] [Google Scholar]
- 15. Long H. K., Prescott S. L., and Wysocka J. (2016) Ever-changing landscapes: transcriptional enhancers in development and evolution. Cell 167, 1170–1187 10.1016/j.cell.2016.09.018 [DOI] [PMC free article] [PubMed] [Google Scholar]
- 16. Fukaya T., Lim B., and Levine M. (2016) Enhancer control of transcriptional bursting. Cell 166, 358–368 10.1016/j.cell.2016.05.025 [DOI] [PMC free article] [PubMed] [Google Scholar]
- 17. Bartman C. R., Hsu S. C., Hsiung C. C., Raj A., and Blobel G. A. (2016) Enhancer regulation of transcriptional bursting parameters revealed by forced chromatin looping. Mol. Cell 62, 237–247 10.1016/j.molcel.2016.03.007 [DOI] [PMC free article] [PubMed] [Google Scholar]
- 18. Hendy O., Campbell J. Jr, Weissman J. D., Larson D. R., and Singer D. S. (2017) Differential context-specific impact of individual core promoter elements on transcriptional dynamics. Mol. Biol. Cell 28, 3360–3370 10.1091/mbc.e17-06-0408 [DOI] [PMC free article] [PubMed] [Google Scholar]
- 19. Senecal A., Munsky B., Proux F., Ly N., Braye F. E., Zimmer C., Mueller F., and Darzacq X. (2014) Transcription factors modulate c-Fos transcriptional bursts. Cell Rep. 8, 75–83 10.1016/j.celrep.2014.05.053 [DOI] [PMC free article] [PubMed] [Google Scholar]
- 20. Cho W. K., Jayanth N., English B. P., Inoue T., Andrews J. O., Conway W., Grimm J. B., Spille J. H., Lavis L. D., Lionnet T., and Cisse I. I. (2016) RNA polymerase II cluster dynamics predict mRNA output in living cells. Elife 5, e13617 10.7554/eLife.13617 [DOI] [PMC free article] [PubMed] [Google Scholar]
- 21. Lovicu F. J., and McAvoy J. W. (2005) Growth factor regulation of lens development. Dev. Biol. 280, 1–14 10.1016/j.ydbio.2005.01.020 [DOI] [PubMed] [Google Scholar]
- 22. Cvekl A., and Ashery-Padan R. (2014) The cellular and molecular mechanisms of vertebrate lens development. Development 141, 4432–4447 10.1242/dev.107953 [DOI] [PMC free article] [PubMed] [Google Scholar]
- 23. Bassnett S., Shi Y., and Vrensen G. F. (2011) Biological glass: structural determinants of eye lens transparency. Philos. Trans. R. Soc. Lond. B Biol. Sci. 366, 1250–1264 10.1098/rstb.2010.0302 [DOI] [PMC free article] [PubMed] [Google Scholar]
- 24. Cvekl A., and Zhang X. (2017) Signaling and gene regulatory networks in mammalian lens development. Trends Genet. 33, 677–702 10.1016/j.tig.2017.08.001 [DOI] [PMC free article] [PubMed] [Google Scholar]
- 25. Sun J., Rockowitz S., Chauss D., Wang P., Kantorow M., Zheng D., and Cvekl A. (2015) Chromatin features, RNA polymerase II and the comparative expression of lens genes encoding crystallins, transcription factors, and autophagy mediators. Mol. Vis. 21, 955–973 [PMC free article] [PubMed] [Google Scholar]
- 26. Bassnett S. (2009) On the mechanism of organelle degradation in the vertebrate lens. Exp. Eye. Res. 88, 133–139 10.1016/j.exer.2008.08.017 [DOI] [PMC free article] [PubMed] [Google Scholar]
- 27. Brennan L. A., McGreal-Estrada R., Logan C. M., Cvekl A., Menko A. S., and Kantorow M. (2018) BNIP3L/NIX is required for elimination of mitochondria, endoplasmic reticulum and Golgi apparatus during eye lens organelle-free zone formation. Exp. Eye Res. 174, 173–184 10.1016/j.exer.2018.06.003 [DOI] [PMC free article] [PubMed] [Google Scholar]
- 28. Chaffee B. R., Shang F., Chang M. L., Clement T. M., Eddy E. M., Wagner B. D., Nakahara M., Nagata S., Robinson M. L., and Taylor A. (2014) Nuclear removal during terminal lens fiber cell differentiation requires CDK1 activity: appropriating mitosis-related nuclear disassembly. Development 141, 3388–3398 10.1242/dev.106005 [DOI] [PMC free article] [PubMed] [Google Scholar]
- 29. Rowan S., Chang M. L., Reznikov N., and Taylor A. (2017) Disassembly of the lens fiber cell nucleus to create a clear lens: the p27 descent. Exp. Eye Res. 156, 72–78 10.1016/j.exer.2016.02.011 [DOI] [PMC free article] [PubMed] [Google Scholar]
- 30. Dahm R., Gribbon C., Quinlan R. A., and Prescott A. R. (1998) Changes in the nucleolar and coiled body compartments precede Lamina and chromatin reorganization during fibre cell denucleation in the bovine lens. Eur. J. Cell Biol. 75, 237–246 10.1016/S0171-9335(98)80118-0 [DOI] [PubMed] [Google Scholar]
- 31. Vrensen G. F., Graw J., and De Wolf A. (1991) Nuclear breakdown during terminal differentiation of primary lens fibres in mice: a transmission electron microscopic study. Exp. Eye Res. 52, 647–659 10.1016/0014-4835(91)90017-9 [DOI] [PubMed] [Google Scholar]
- 32. He S., Limi S., McGreal R. S., Xie Q., Brennan L. A., Kantorow W. L., Kokavec J., Majumdar R., Hou H. Jr., Edelmann W., Liu W., Ashery-Padan R., Zavadil J., Kantorow M., Skoultchi A. I., et al. (2016) Chromatin remodeling enzyme Snf2h regulates embryonic lens differentiation and denucleation. Development 143, 1937–1947 10.1242/dev.135285 [DOI] [PMC free article] [PubMed] [Google Scholar]
- 33. Nishimoto S., Kawane K., Watanabe-Fukunaga R., Fukuyama H., Ohsawa Y., Uchiyama Y., Hashida N., Ohguro N., Tano Y., Morimoto T., Fukuda Y., and Nagata S. (2003) Nuclear cataract caused by a lack of DNA degradation in the mouse eye lens. Nature 424, 1071–1074 10.1038/nature01895 [DOI] [PubMed] [Google Scholar]
- 34. Dluhosova M., Curik N., Vargova J., Jonasova A., Zikmund T., and Stopka T. (2014) Epigenetic control of SPI1 gene by CTCF and ISWI ATPase SMARCA5. PLoS One 9, e87448 10.1371/journal.pone.0087448 [DOI] [PMC free article] [PubMed] [Google Scholar]
- 35. Cavellán E., Asp P., Percipalle P., and Farrants A.-K. (2006) The WSTF-SNF2h chromatin remodeling complex interacts with several nuclear proteins in transcription. J. Biol. Chem. 281, 16264–16271 10.1074/jbc.M600233200 [DOI] [PubMed] [Google Scholar]
- 36. Erdel F., and Rippe K. (2011) Chromatin remodelling in mammalian cells by ISWI-type complexes–where, when and why? FEBS J. 278, 3608–3618 10.1111/j.1742-4658.2011.08282.x [DOI] [PubMed] [Google Scholar]
- 37. Precht P., Wurster A. L., and Pazin M. J. (2010) The SNF2H chromatin remodeling enzyme has opposing effects on cytokine gene expression. Mol. Immunol. 47, 2038–2046 10.1016/j.molimm.2010.04.009 [DOI] [PMC free article] [PubMed] [Google Scholar]
- 38. Levesque M. J., and Raj A. (2013) Single-chromosome transcriptional profiling reveals chromosomal gene expression regulation. Nat. Methods 10, 246–248 10.1038/nmeth.2372 [DOI] [PMC free article] [PubMed] [Google Scholar]
- 39. Zenklusen D., and Singer R. H. (2010) Analyzing mRNA expression using single mRNA resolution fluorescent in situ hybridization. Methods Enzymol. 470, 641–659 10.1016/S0076-6879(10)70026-4 [DOI] [PMC free article] [PubMed] [Google Scholar]
- 40. Eliscovich C., Shenoy S. M., and Singer R. H. (2017) Imaging mRNA and protein interactions within neurons. Proc. Natl. Acad. Sci. U.S.A. 114, E1875–E1884 10.1073/pnas.1621440114 [DOI] [PMC free article] [PubMed] [Google Scholar]
- 41. Zhao B., Mei Y., Schipma M. J., Roth E. W., Bleher R., Rappoport J. Z., Wickrema A., Yang J., and Ji P. (2016) Nuclear condensation during mouse erythropoiesis requires caspase-3–mediated nuclear opening. Dev. Cell 36, 498–510 10.1016/j.devcel.2016.02.001 [DOI] [PMC free article] [PubMed] [Google Scholar]
- 42. van Bavel C. C., Dieker J., Muller S., Briand J.-P., Monestier M., Berden J. H., and van der Vlag J. (2009) Apoptosis-associated acetylation on histone H2B is an epitope for lupus autoantibodies. Mol. Immunol. 47, 511–516 10.1016/j.molimm.2009.08.009 [DOI] [PubMed] [Google Scholar]
- 43. Narlikar G. J., Fan H. Y., and Kingston R. E. (2002) Cooperation between complexes that regulate chromatin structure and transcription. Cell 108, 475–487 10.1016/S0092-8674(02)00654-2 [DOI] [PubMed] [Google Scholar]
- 44. Raj A., Peskin C. S., Tranchina D., Vargas D. Y., and Tyagi S. (2006) Stochastic mRNA synthesis in mammalian cells. PLoS Biol. 4, e309 10.1371/journal.pbio.0040309 [DOI] [PMC free article] [PubMed] [Google Scholar]
- 45. Itzkovitz S., and van Oudenaarden A. (2011) Validating transcripts with probes and imaging technology. Nat. Methods 8, S12–S19 10.1038/nmeth.1573 [DOI] [PMC free article] [PubMed] [Google Scholar]
- 46. Itzkovitz S., Lyubimova A., Blat I. C., Maynard M., van Es J., Lees J., Jacks T., Clevers H., and van Oudenaarden A. (2011) Single-molecule transcript counting of stem-cell markers in the mouse intestine. Nat. Cell Biol. 14, 106–114 [DOI] [PMC free article] [PubMed] [Google Scholar]
- 47. Kiefer C. M., Lee J., Hou C., Dale R. K., Lee Y. T., Meier E. R., Miller J. L., and Dean A. (2011) Distinct Ldb1/NLI complexes orchestrate γ-globin repression and reactivation through ETO2 in human adult erythroid cells. Blood 118, 6200–6208 10.1182/blood-2011-06-363101 [DOI] [PMC free article] [PubMed] [Google Scholar]
- 48. Woo A. J., Kim J., Xu J., Huang H., and Cantor A. B. (2011) Role of ZBP-89 in human globin gene regulation and erythroid differentiation. Blood 118, 3684–3693 10.1182/blood-2011-03-341446 [DOI] [PMC free article] [PubMed] [Google Scholar]
- 49. Haimovich G., Medina D. A., Causse S. Z., Garber M., Millán-Zambrano G., Barkai O., Chávez S., Pérez-Ortín J. E., Darzacq X., and Choder M. (2013) Gene expression is circular: factors for mRNA degradation also foster mRNA synthesis. Cell 153, 1000–1011 10.1016/j.cell.2013.05.012 [DOI] [PubMed] [Google Scholar]
- 50. Caveney P. M., Norred S. E., Chin C. W., Boreyko J. B., Razooky B. S., Retterer S. T., Collier C. P., and Simpson M. L. (2017) Resource sharing controls gene expression bursting. ACS Synth. Biol. 6, 334–343 [DOI] [PubMed] [Google Scholar]
- 51. Yang Y., Stopka T., Golestaneh N., Wang Y., Wu K., Li A., Chauhan B. K., Gao C. Y., Cveklová K., Duncan M. K., Pestell R. G., Chepelinsky A. B., Skoultchi A. I., and Cvekl A. (2006) Regulation of αA-crystallin via Pax6, c-Maf, CREB and a broad domain of lens-specific chromatin. EMBO J. 25, 2107–2118 10.1038/sj.emboj.7601114 [DOI] [PMC free article] [PubMed] [Google Scholar]
- 52. Wolf L., Yang Y., Wawrousek E., and Cvekl A. (2008) Transcriptional regulation of mouse αA-crystallin gene in a 148-kb Cryaa BAC and its derivates. BMC Dev. Biol. 8, 88 10.1186/1471-213X-8-88 [DOI] [PMC free article] [PubMed] [Google Scholar]
- 53. Goring D. R., Bryce D. M., Tsui L.-C., Breitman M. L., and Liu Q. (1993) Developmental regulation and cell type-specific expression of the murine γF-crystallin gene is mediated through a lens-specific element containing the γF-1 binding site. Dev. Dyn. 196, 143–152 10.1002/aja.1001960208 [DOI] [PubMed] [Google Scholar]
- 54. Chen W. V., Fielding Hejtmancik J., Piatigorsky J., and Duncan M. K. (2001) The mouse βB1-crystallin promoter: strict regulation of lens fiber cell specificity. Biochim. Biophys. Acta 1519, 30–38 10.1016/S0167-4781(01)00201-9 [DOI] [PubMed] [Google Scholar]
- 55. Sun J., Rockowitz S., Xie Q., Ashery-Padan R., Zheng D., and Cvekl A. (2015) Identification of in vivo DNA-binding mechanisms of Pax6 and reconstruction of Pax6-dependent gene regulatory networks during forebrain and lens development. Nucleic Acids Res. 43, 6827–6846 10.1093/nar/gkv589 [DOI] [PMC free article] [PubMed] [Google Scholar]
- 56. Alvarez-Saavedra M., De Repentigny Y., Lagali P. S., Raghu Ram E. V., Yan K., Hashem E., Ivanochko D., Huh M. S., Yang D., Mears A. J., Todd M. A., Corcoran C. P., Bassett E. A., Tokarew N. J., Kokavec J., et al. (2014) Snf2h-mediated chromatin organization and histone H1 dynamics govern cerebellar morphogenesis and neural maturation. Nat. Commun. 5, 4181 10.1038/ncomms5181 [DOI] [PMC free article] [PubMed] [Google Scholar]
- 57. Sala A., Toto M., Pinello L., Gabriele A., Di Benedetto V., Ingrassia A. M., Lo Bosco G., Di Gesù V., Giancarlo R., and Corona D. F. (2011) Genome-wide characterization of chromatin binding and nucleosome spacing activity of the nucleosome remodelling ATPase ISWI. EMBO J. 30, 1766–1777 10.1038/emboj.2011.98 [DOI] [PMC free article] [PubMed] [Google Scholar]
- 58. Yoshida H., Kawane K., Koike M., Mori Y., Uchiyama Y., and Nagata S. (2005) Phosphatidylserine-dependent engulfment by macrophages of nuclei from erythroid precursor cells. Nature 437, 754–758 10.1038/nature03964 [DOI] [PubMed] [Google Scholar]
- 59. Eckhart L., Lippens S., Tschachler E., and Declercq W. (2013) Cell death by cornification. Biochim. Biophys. Acta 1833, 3471–3480 10.1016/j.bbamcr.2013.06.010 [DOI] [PubMed] [Google Scholar]
- 60. Akinduro O., Sully K., Patel A., Robinson D. J., Chikh A., McPhail G., Braun K. M., Philpott M. P., Harwood C. A., Byrne C., O'Shaughnessy R. F. L., and Bergamaschi D. (2016) Constitutive autophagy and nucleophagy during epidermal differentiation. J. Invest. Dermatol. 136, 1460–1470 10.1016/j.jid.2016.03.016 [DOI] [PubMed] [Google Scholar]
- 61. Fischer H., Szabo S., Scherz J., Jaeger K., Rossiter H., Buchberger M., Ghannadan M., Hermann M., Theussl H. C., Tobin D. J., Wagner E. F., Tschachler E., and Eckhart L. (2011) Essential role of the keratinocyte-specific endonuclease DNase1L2 in the removal of nuclear DNA from hair and nails. J. Invest. Dermatol. 131, 1208–1215 10.1038/jid.2011.13 [DOI] [PMC free article] [PubMed] [Google Scholar]
- 62. Zandy A. J., Lakhani S., Zheng T., Flavell R. A., and Bassnett S. (2005) Role of the executioner caspases during lens development. J. Biol. Chem. 280, 30263–30272 10.1074/jbc.M504007200 [DOI] [PubMed] [Google Scholar]
- 63. Karásek J. (1988) Nuclear morphology of transitional keratinocytes in normal human epidermis. J. Invest. Dermatol. 91, 243–246 10.1111/1523-1747.ep12470372 [DOI] [PubMed] [Google Scholar]
- 64. Pietrowski D., Durante M. J., Liebstein A., Schmitt-John T., Werner T., and Graw J. (1994) α-Crystallins are involved in specific interactions with the murine γD/E/F-crystallin-encoding gene. Gene 144, 171–178 10.1016/0378-1119(94)90375-1 [DOI] [PubMed] [Google Scholar]
- 65. den Engelsman J., Bennink E. J., Doerwald L., Onnekink C., Wunderink L., Andley U. P., Kato K., de Jong W. W., and Boelens W. C. (2004) Mimicking phosphorylation of the small heat-shock protein αB-crystallin recruits the F-box protein FBX4 to nuclear SC35 speckles. Eur. J. Biochem. 271, 4195–4203 10.1111/j.1432-1033.2004.04359.x [DOI] [PubMed] [Google Scholar]
- 66. Sandilands A., Hutcheson A. M., Long H. A., Prescott A. R., Vrensen G., Löster J., Klopp N., Lutz R. B., Graw J., Masaki S., Dobson C. M., MacPhee C. E., and Quinlan R. A. (2002) Altered aggregation properties of mutant γcrystallins cause inherited cataract. EMBO J. 21, 6005–6014 10.1093/emboj/cdf609 [DOI] [PMC free article] [PubMed] [Google Scholar]
- 67. Andley U. P., Patel H. C., and Xi J. H. (2002) The R116C mutation in αA-crystallin diminishes its protective ability against stress-induced lens epithelial cell apoptosis. J. Biol. Chem. 277, 10178–10186 10.1074/jbc.M109211200 [DOI] [PubMed] [Google Scholar]
- 68. Pietrowski D., and Graw J. (1997) Autokinase activity of α-crystallin inhibits its specific interaction with the DOTIS element in the murine γD/E/F-crystallin promoter in vitro. Biol. Chem. 378, 1183–1186 [PubMed] [Google Scholar]
- 69. van den IJssel P., Wheelock R., Prescott A., Russell P., and Quinlan R. A. (2003) Nuclear speckle localisation of the small heat shock protein αB-crystallin and its inhibition by the R120G cardiomyopathy-linked mutation. Exp. Cell Res. 287, 249–261 10.1016/S0014-4827(03)00092-2 [DOI] [PubMed] [Google Scholar]
- 70. Lionnet T., Czaplinski K., Darzacq X., Shav-Tal Y., Wells A. L., Chao J. A., Park H. Y., de Turris V., Lopez-Jones M., and Singer R. H. (2011) A transgenic mouse for in vivo detection of endogenous labeled mRNA. Nat. Methods 8, 165–170 10.1038/nmeth.1551 [DOI] [PMC free article] [PubMed] [Google Scholar]
Associated Data
This section collects any data citations, data availability statements, or supplementary materials included in this article.


