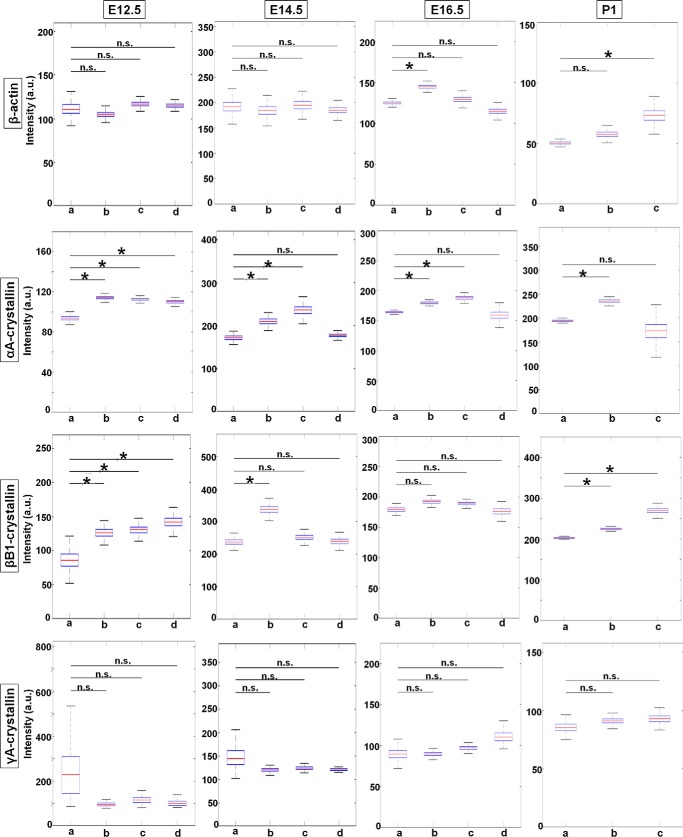
Figure 7.
Transcriptional intensities of β-actin, αA-, βB1-, and γA-crystallin genes at mouse embryonic developmental stages E12.5, E14.5, E16.5, and newborn P1 lens during lens cell differentiation show varying transcriptional bursting patterns for each gene. Representative experiments show mean fluorescence intensities of nascent transcription sites of the four indicated genes at the indicated mouse developmental stages within each of the indicated lens tissue areas. Data are shown as box plots to show the distribution. * denotes significance with p value ≤0.05; n.s. indicates not significant; a.u. denotes arbitrary units. Number of TSs analyzed is shown in Table S2. Standard deviations of these measurements are given in Table S4.

