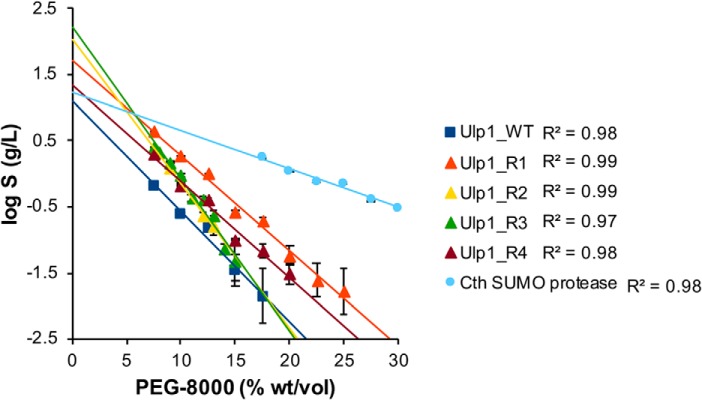
Figure 3.
Precipitation assays of SUMO proteases. Data points indicate the concentration of soluble protease remaining after equilibration at room temperature with increasing concentrations of the protein precipitant, PEG 8000. The y intercept of each log-linear trend line is S0, and this value represents the theoretical maximum solubility of the protein in the absence of precipitant. Error bars, S.D. from three or more replicates.

