Figure 1.

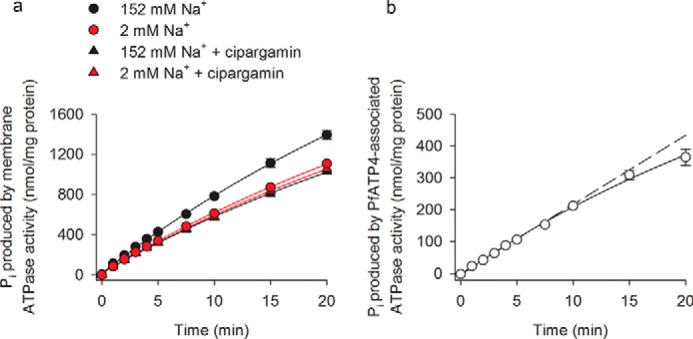
Time course for Pi production by ATPases in P. falciparum membranes. a, amount of Pi produced by P. falciparum membranes was measured under high-[Na+] (152 mm) and low-[Na+] (2 mm) conditions in the presence and absence of 500 nm cipargamin. b, amount of Pi produced in the high-[Na+] condition in the presence of cipargamin was subtracted from that obtained in the high-[Na+] condition in the absence of cipargamin to determine the “PfATP4-associated ATPase activity.” The dashed line indicates the amount of Pi that would be produced if PfATP4-associated ATPase activity continued at the initial rate for the duration of the experiment. The data were obtained with Dd2 parasites and are shown as the mean (± S.D.) from three independent experiments, each performed on different days with different membrane preparations. Where not shown, the error bars fall within the symbols. The ATP concentration was 1 mm.
