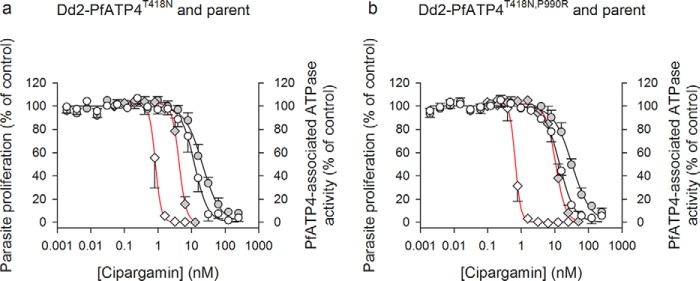
Figure 6.
Potency of cipargamin against parasite growth (red curves) and PfATP4-associated ATPase activity (black curves) in PfATP4-mutant lines and their parents. The data for Dd2-PfATP4T418N and its parent (a) and Dd2-PfATP4T418N,P990R and its parent (b) were obtained from the number of independent experiments indicated in Table 1, and they are shown as the mean ± S.D. Where not shown, the error bars fall within the symbols. Parasite proliferation data for the PfATP4-mutant lines (gray symbols) and their parental lines (white symbols) are shown with diamonds and red lines, and data for PfATP4-associated ATPase activity are shown with circles and black lines. For clarity, only upward error bars are shown for data obtained with the PfATP4-mutant lines, and only downward error bars are shown for data obtained with the parental lines. ATPase activity was determined at pH 7.2 in the presence of 152 mm Na+ and 1 mm ATP. In each case the data were fit to a sigmoidal curve: y = a/(1 + ([cipargamin]/IC50)b, where a is the maximum y value, and b is a fitted constant.

