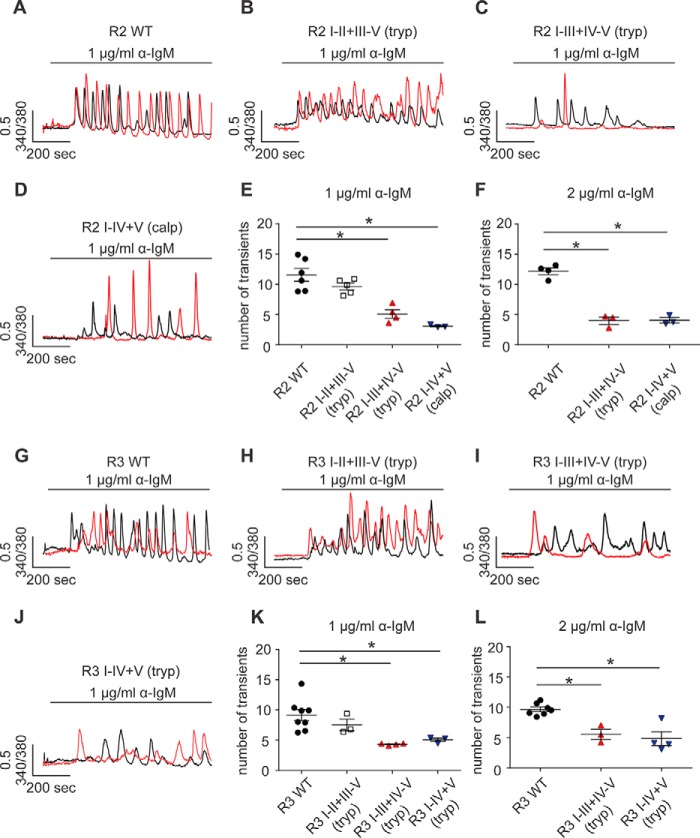
Figure 8.
Region-specific fragmentation alters the temporal Ca2+ release profile of R2 and R3. A–L, a panel of DT40–3KO cells, each stably expressing a pair of complementary polypeptides representing fragmented R2 or R3 at particular sites, were loaded with Fura-2/AM, followed by stimulation of B-cell receptor activation with anti-IgM. Single-cell Ca2+ imaging recording showed that fragmentation at the proximal N-terminal solvent-exposed region had no impact on the frequency of Ca2+ oscillations mediated by R2 (A, B, and E) and R3 (G, H, and K). However, receptor fragmentation more toward the C terminus resulted in a significant decrease in Ca2+ oscillations mediated by fragmented R2 (C–E) and fragmented R3 (I–K). This decrease in the frequency of Ca2+ oscillations could not be rescued by increasing the concentrations of stimuli (F and L). *, statistical significance determined by one-way ANOVA followed by Tukey's multiple comparisons test.

