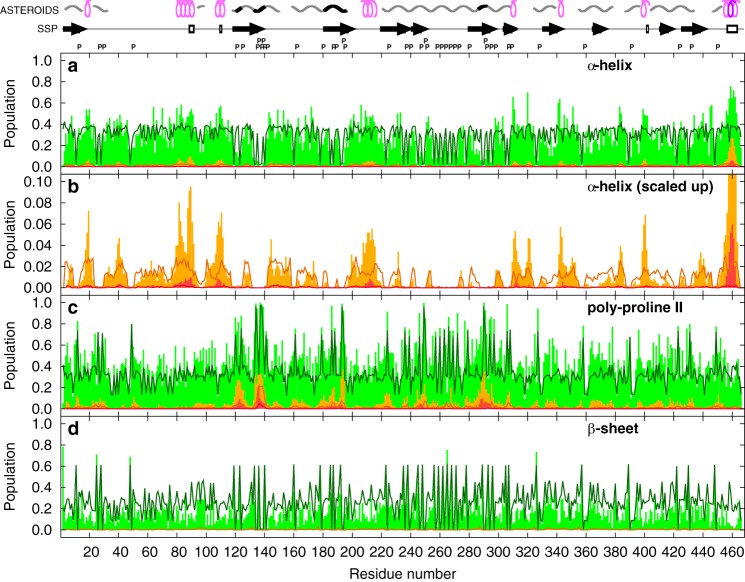
Figure 4.
Populations of torsion angles in the regions of the Ramachandran plot corresponding to the helical (a and b), polyproline-II (c), and β-sheet (d) conformations. Populations of individual residues and of continuous stretches of four and seven amino acids in the given conformation in the ensembles of 600 structures selected by the ASTEROIDS analysis of unphosphorylated MAP2c are shown as green, orange, and red bars, respectively. The orange and red bars are placed in the middle of the stretches. Populations in the statistical coil pool of structures are plotted as solid dark green, dark orange, and dark red lines, respectively. Letters P above the plots indicate positions of prolines. Regions of extended and helical conformations calculated using the SSP program (13, 35) are displayed as arrows and empty rectangles above the plots, respectively. Regions where the population of stretches of four amino acids in the α-helical conformation exceeds 5 and 25%, respectively, are displayed as pink and purple symbols in the top row above the plots, and regions where the population of stretches of four amino acids in the polyproline II conformation exceeds 5 and 25%, respectively, are displayed as gray and black symbols in the top row above the plots.

