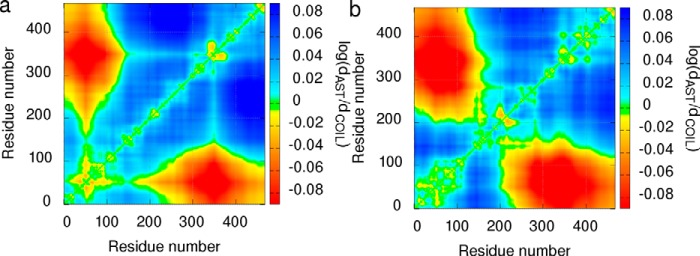
Figure 5.
Distance maps of 70 μm unphosphorylated (a) and 0.3 mm phosphorylated (b) MAP2c. The distances between individual residues in 600 structures selected by the ASTEROIDS analysis are expressed as a logarithm of the ratio of distances observed in the selected ensemble (dAST) to the distances in the statistical coil pool (dCOIL) and plotted using the displayed color scale (red, shorter average distance in the selected ensemble; blue, longer average distance in the selected ensemble).

