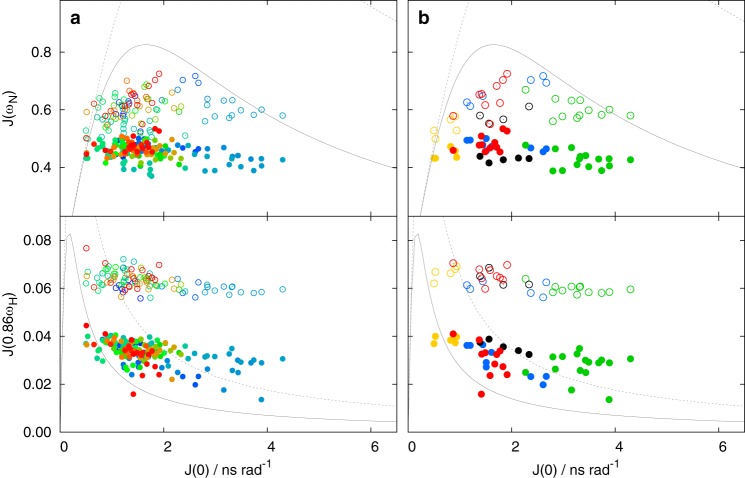
Figure 7.
Values of spectral density function of unphosphorylated MAP2c. The J(0) values in all plots were calculated from R1, Γx, and steady-state NOE measured at 950 MHz. The J(ωN) and J(0.86ωH) values calculated from R1 and steady-state NOE for ωN = 61 MHz and ωH = 600 MHz are displayed as open circles. The J(ωN) and J(0.86ωH) values calculated from R1 and steady-state NOE for ωN = 96 MHz and ωH = 950 MHz are displayed as filled circles. a, all available values are displayed in a as circles color-coded in a rainbow manner according to the residue number (N terminus is shown in blue, C terminus in red). b, values for selected regions are shown as circles colored according to the regions: vicinity of Trp14 and Glu51 in blue, RII site in green, MTBR3 in black, C-terminal α helix in red, and vicinity of Ser157 in gold (see Fig. 1). The limits corresponding to mono-exponential TCF for 600- and 950-MHz spectrometers are plotted as dotted and solid gray curves, respectively.

