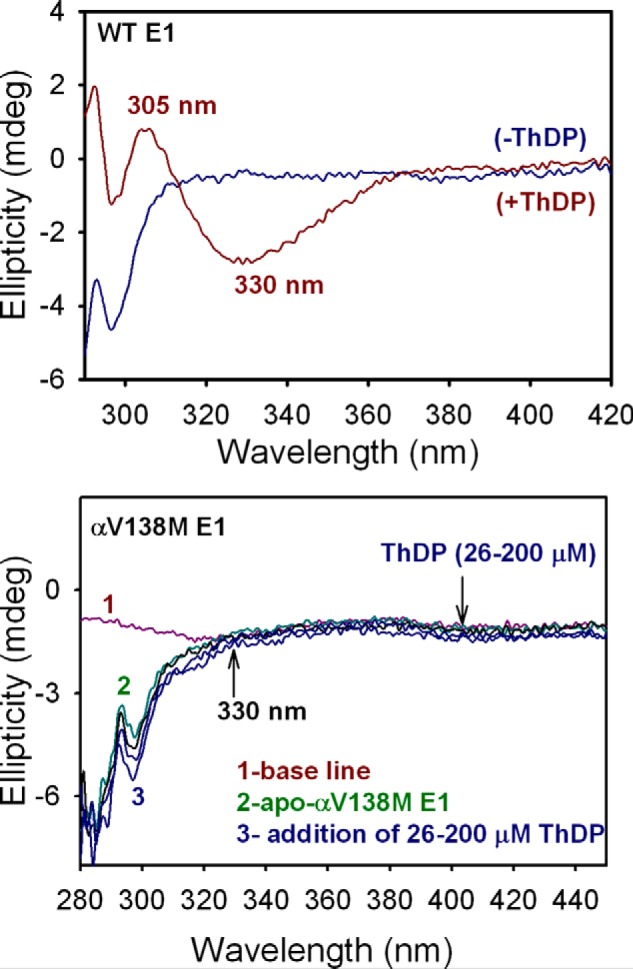
Figure 7.

Near-UV CD spectra of WT E1 and αV138M E1 titrated with ThDP. Top, CD spectra of apo-WT E1 (25 μm concentration of active centers) in 10 mm KH2PO4 (pH 7.0) containing 1 mm MgCl2 were recorded in the absence (blue) and presence of 0.20 mm ThDP (red). Upon addition of ThDP to WT E1, a positive and a negative CD band (at 305 and 330 nm, respectively) developed, corresponding to the IP and AP tautomers of ThDP, respectively, when bound to WT E1. Bottom, apo-αV138M E1 (26 μm active centers, green) in 20 mm KH2PO4 (pH 7.0) containing 1 mm MgCl2 was titrated with ThDP (26–200 μm, blue). The spectra do not display the CD bands at 305 and 330 nm, indicating that ThDP binding in the active centers of αV138M E1 is altered compared with WT E1.
