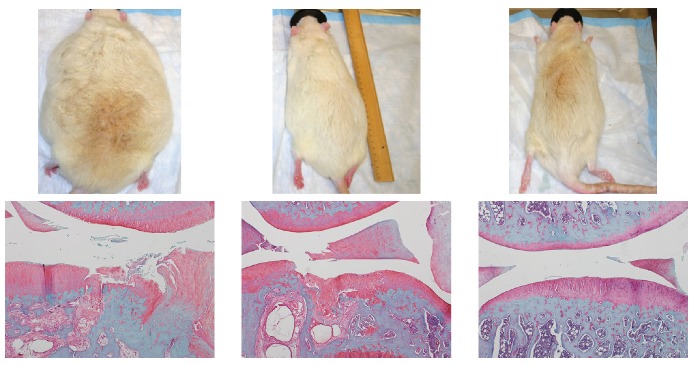
Figure 3.
Exemplar rats with high body fat and high weight (left), high body fat and normal weight (middle) and normal body fat and normal weight (right) and associated exemplar histological samples of the knee following 28 weeks on a HFS diet (left and middle rats) and a normal control diet (right rat). Note that the severity of knee joint degeneration is similar in the rats with the high percentage of body fat (left and middle), despite unequal body weight, while joint degeneration is substantially greater in the middle compared with the right rat despite similar body weight but unequal body fat percentage. HFS, high-fat, high-sucrose.

