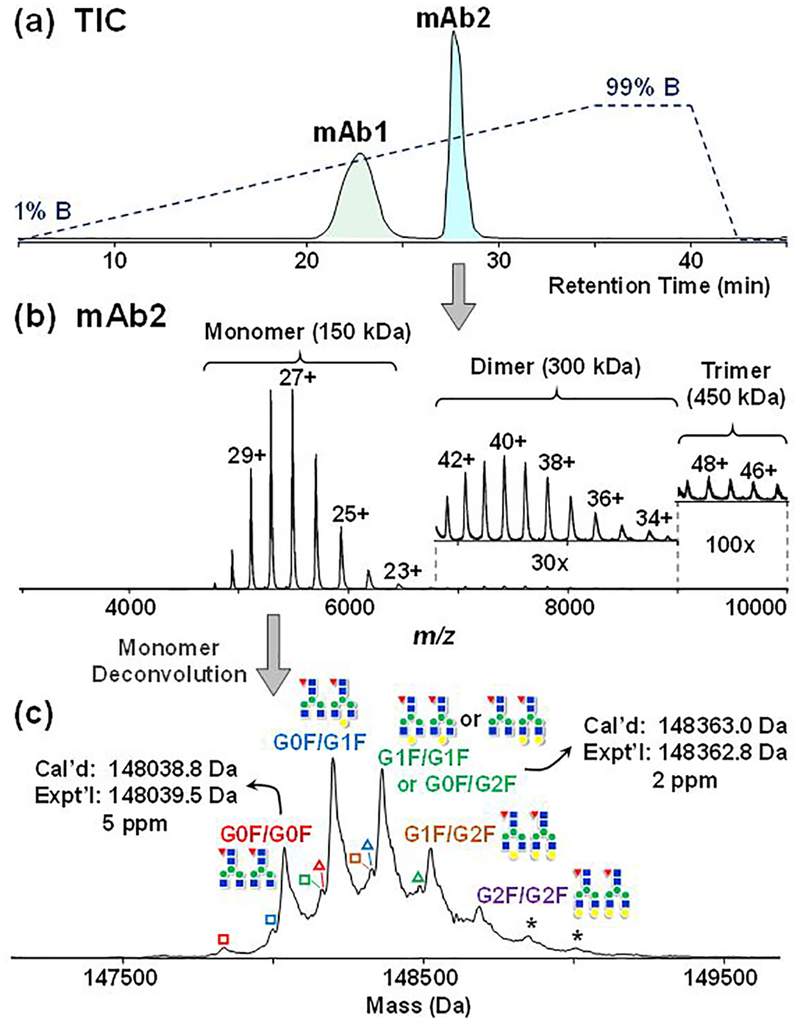
Figure 1.
Online HIC-MS of mAb mixtures on a maXis II Q-TOF mass spectrometer. (a) Total ion chromatogram demonstrating the separation of mAb1 and mAb2. The dash line indicates the gradient changes of mobile phase B. (b) Mass spectrum of mAb2 showing the detection of monomers, dimers (30× zoom-in), and trimers (100× zoom-in). (c) Deconvoluted mass spectrum of mAb2 monomer with annotated glycosylation forms (red triangle: Fucose; blue square: GlcNAc; green circle: Mannose; yellow circle: Galactose); hollow square represents the loss of one GlcNAc (−204 Da), hollow triangle represents the preservation of C-terminal Lys on heavy chain (+128 Da) and asterisk * represents the addition of a hexose (+162 Da). GxF indicates Fc-oligosaccharides terminated by x number of galactoses.

