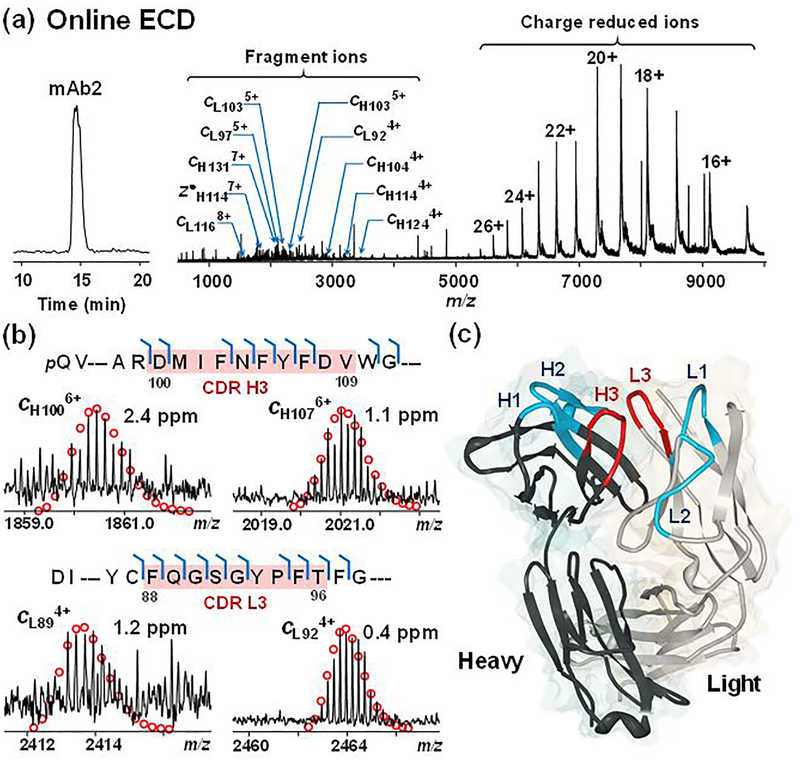
Figure 2.
Online HIC-MS/MS with broadband ECD of deglycosylated mAb2 on a 12T solariX XR FT-ICR mass spectrometer. (a) Chromatogram and ECD spectrum of mAb2 showing charge reduced species and fragment ions. (b) Representative fragment ions from the CDRs H3 and L3 (highlighted in red) of heavy chain (top) and light chain (bottom). (c) Crystal structure of the Fab fragment of mAb2 (PDB 5K8A). The CDRs fragmented by ECD (H3 and L3) are highlighted in red, and the other CDRs are highlighted in blue (H1, H2, L1, and L2).

