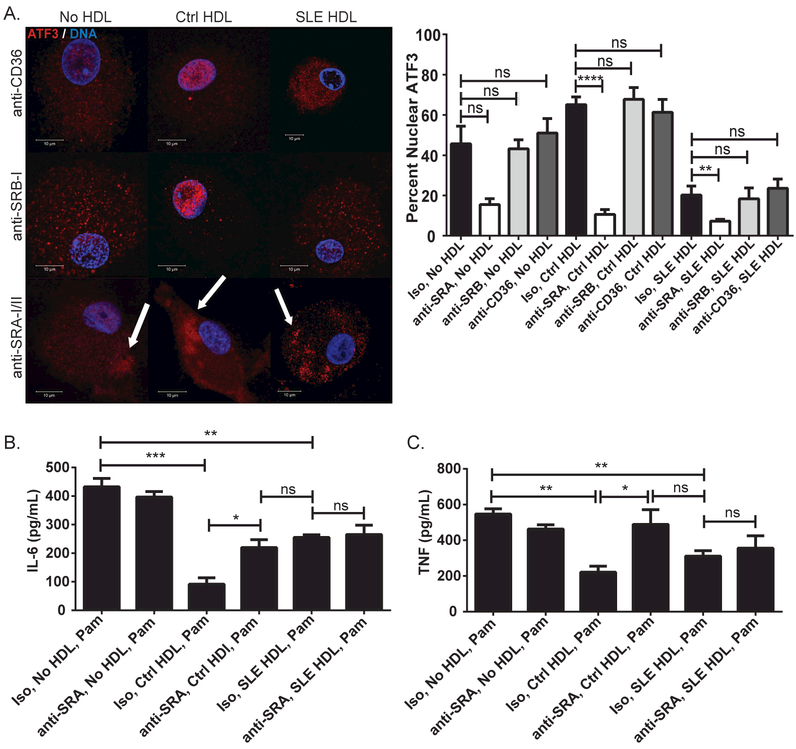
Figure 5. Binding of Ctrl HDL to SR-AI/II modulates ATF3 cellular localization and anti-inflammatory activity.
(A) Effect of SR blockade in ATF3 cellular localization in CMϕ (N=15) prior to exposure to Ctrl (N=7) or SLE (N=7) HDL treatment for 30min. White arrows indicated ATF3 cytoplasmic aggregates. Images are representative of conditions performed in triplicate. Co-localization bar graphs are as in Fig3A. Result of SR-AI/II blockade (or Iso control) on (B) IL-6 and (C) TNF synthesis induced in CMϕ (N=5) exposed to Ctrl (N=5) or SLE (N=5) HDL for 4hr, then Pam3CSK4 (Pam) overnight (protein in supernatants). Bar graphs are mean ± SEM, * p<0.04, ** p<0.008, *** p<0.0009, **** p<0.0001, ns =non-significant.

