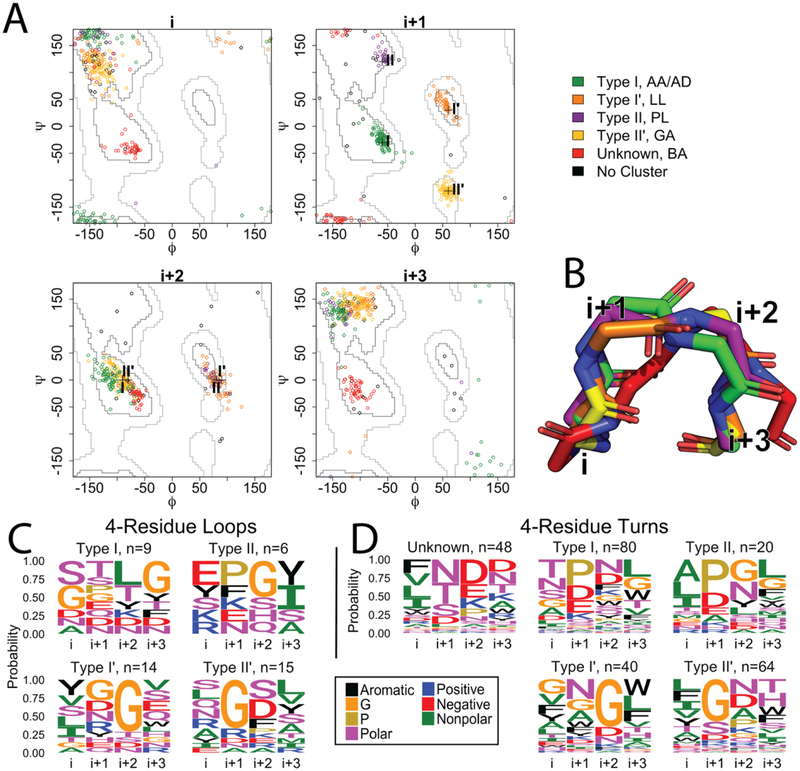
Figure 2. Four residue strand connectors.
A) Clustering of the 4-residue loops and turns of OMBBs. Loops are shown with diamond markers; turns are represented by circle markers. The plus symbols in the i+1 and i+2 plots mark four of the previously defined ideal turn types I, II, I’, and II’ as noted by Guruprasad and Rajkumar (2000). Green: type I; orange: type I’; purple: type II; yellow: type II’; red: unknown; black: no cluster. B) Representative example of each cluster, colored as in A. The red cluster has terminal positions spaced further apart than the other four canonical tight turn types. C and D) Sequence logos for the 4-residue strand connectors. Each position is shown as a column; the number of sequences in a cluster is shown in the subtitle. Amino acid groupings are described in the methods. C) Sequence logos for the 4-residue loops. D) Sequence logos for the 4-residue turns.

