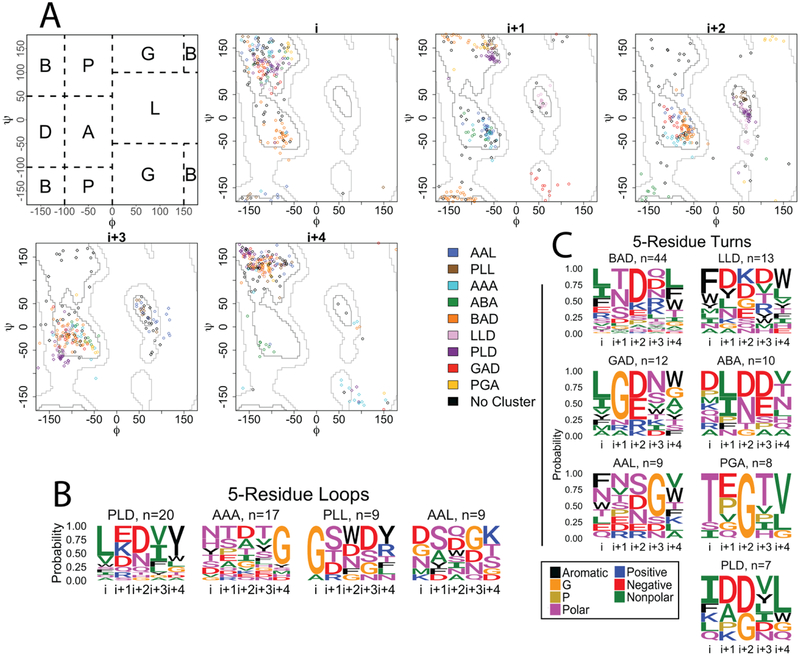
Figure 4. 5-residue strand connectors.
A) Clustering of the 5-residue loops and turns of OMBBs. Loops are shown with diamond markers; turns are represented by circles markers. The first panel shows the division of the Ramachandran plot into regions according to North et al. 2011. The other 5 plots show the phi/psi angles for each residue in the strand connector. B) Sequence logos for the 5-residue loops. C) Sequence logos for the 5-residue turns. Sequence logos are colored and grouped as in Figure 2.

