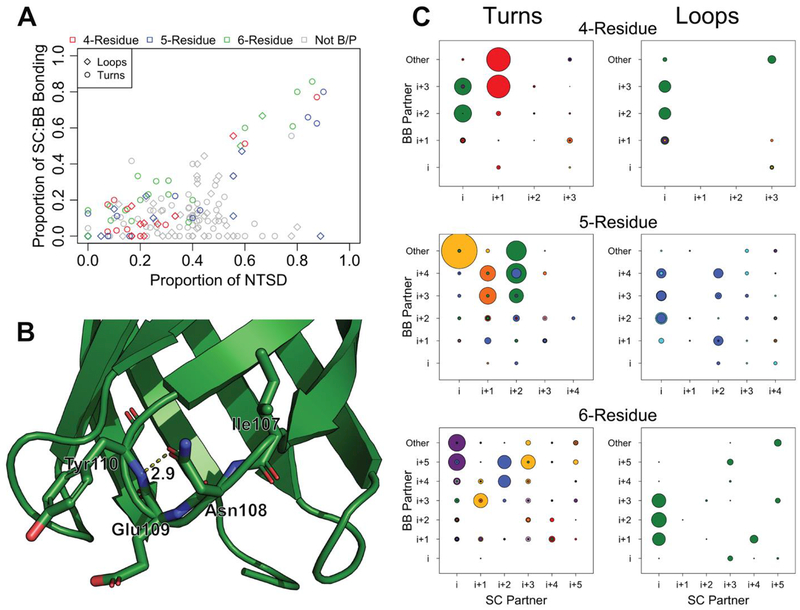
Figure 6. Side chain backbone bonding in strand connectors.
A) Proportion of Asn, Thr, Ser, and Asp (NTSD) in any position compared to the proportion of sidechains donated to a side-chain:backbone hydrogen bond at that position. Positions that fall outside the B or P region of the Ramachandran plot are shown in grey. B) Turn 2 of PDB ID 3qra. The side-chain:backbone hydrogen bond between the side chain of i+1 Asn108 and the backbone of i+3 Tyr110 is shown in dotted lines. Glu109 is the i+2 residue and its side chain points directly outward. C) The proportion of sidechain:backbone hydrogen bonding at each pair of positions. The identity of the sidechain partner is shown along the x-axis; the identity of the backbone partner is shown along the y-axis. “Other” indicates hydrogen bonding to a backbone partner outside the loop. The radius of the circles is equivalent to the proportion of structures at that position involved in bonding. Circles are colored to match the clusters marked on the Ramachandran plots in Figs 2, 4 and 5. P-values for each position and each bond type are reported in the supplemental file HBondsByCluster_PValues.xlsx.

