Figure 2:

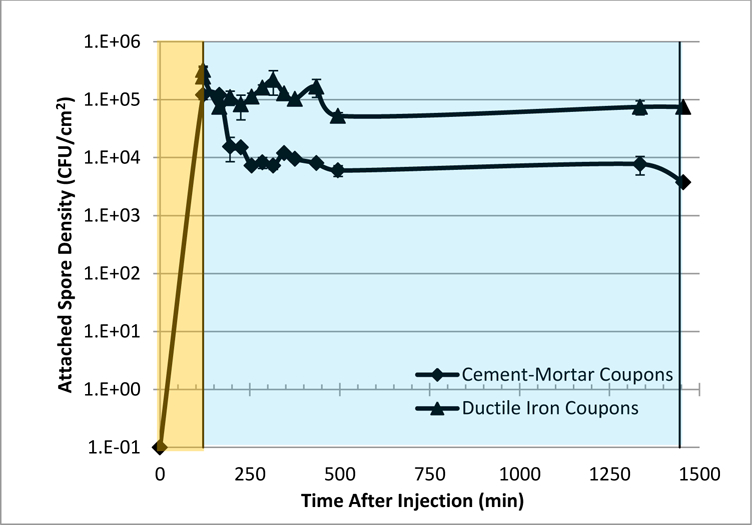
Spore density on iron and cement-mortar coupons after flushing at 0.5 m sec−1 (1.7 ft sec−1). The orange section represents the period when spores were injected. The blue section represents decontamination by flushing.

Spore density on iron and cement-mortar coupons after flushing at 0.5 m sec−1 (1.7 ft sec−1). The orange section represents the period when spores were injected. The blue section represents decontamination by flushing.