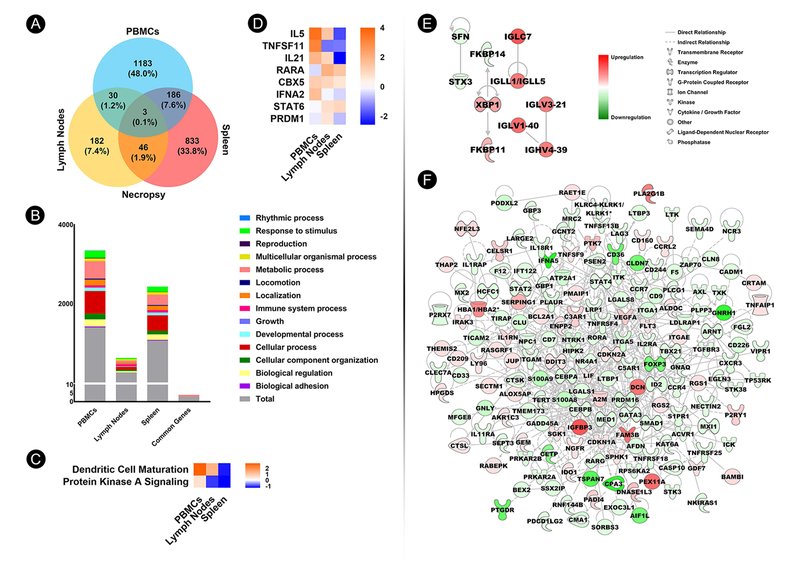
Fig. 6.
Systems biology approach to identify molecular signatures in PBMCs, lymph nodes, and spleen. (A) Venn diagram depicting numbers and percentages of significant differentially expressed genes (DEGs) (p<0.05; 1.5-fold change cutoff) in Sm-p80–immunized baboon PBMCs, lymph nodes, and spleen at necropsy. (B) Distribution of DEGs (y-axis) in Sm-p80–immunized baboon PBMCs and secondary lymphoid tissues, as well as DEGs common to all tissues at necropsy according to ontology classification. (C) Heat map depicting IPA-identified common canonical pathways with activation z-score for which scores were available and not zero. (D) Heat map depicting IPA-identified common upstream regulators with activation z-scores for which scores were available and not zero. (E) Gene network derived from immune-related DEGs in baboon lymph nodes at necropsy. (F) Gene network derived from immune-related DEGs in baboon spleen at necropsy.

