
Figure 6.
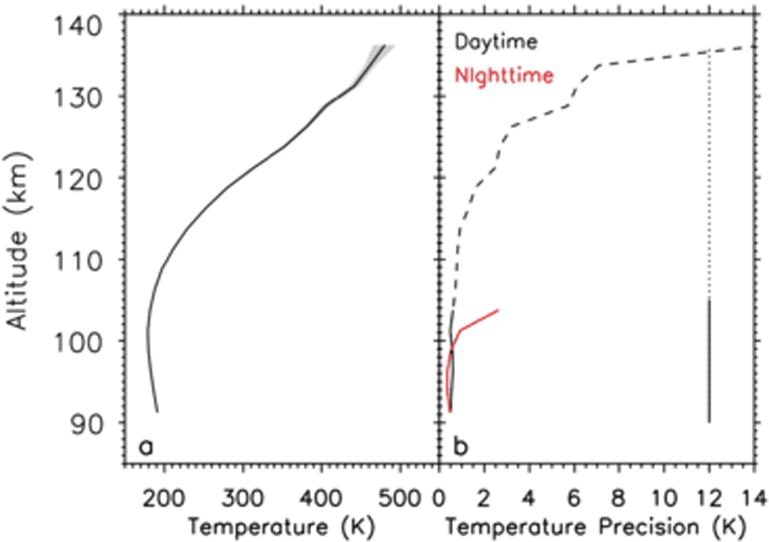
(a) Averaged retrieved daytime temperature with estimated 1-σ uncertainty overplotted as the shaded area. The uncertainties are calculated as the standard deviation of the average over all simulations. (b) The average 1-σ uncertainty (temperature precision) shown in Figure 6a. The altitudes shown by the solid line (90-105 km) represent the region of primary MIGHTI science. The red line shows the result for a nighttime retrieval. The vertical line at 12 K shows the precision required between 90-105 km (solid) and extended to higher altitudes (dotted).