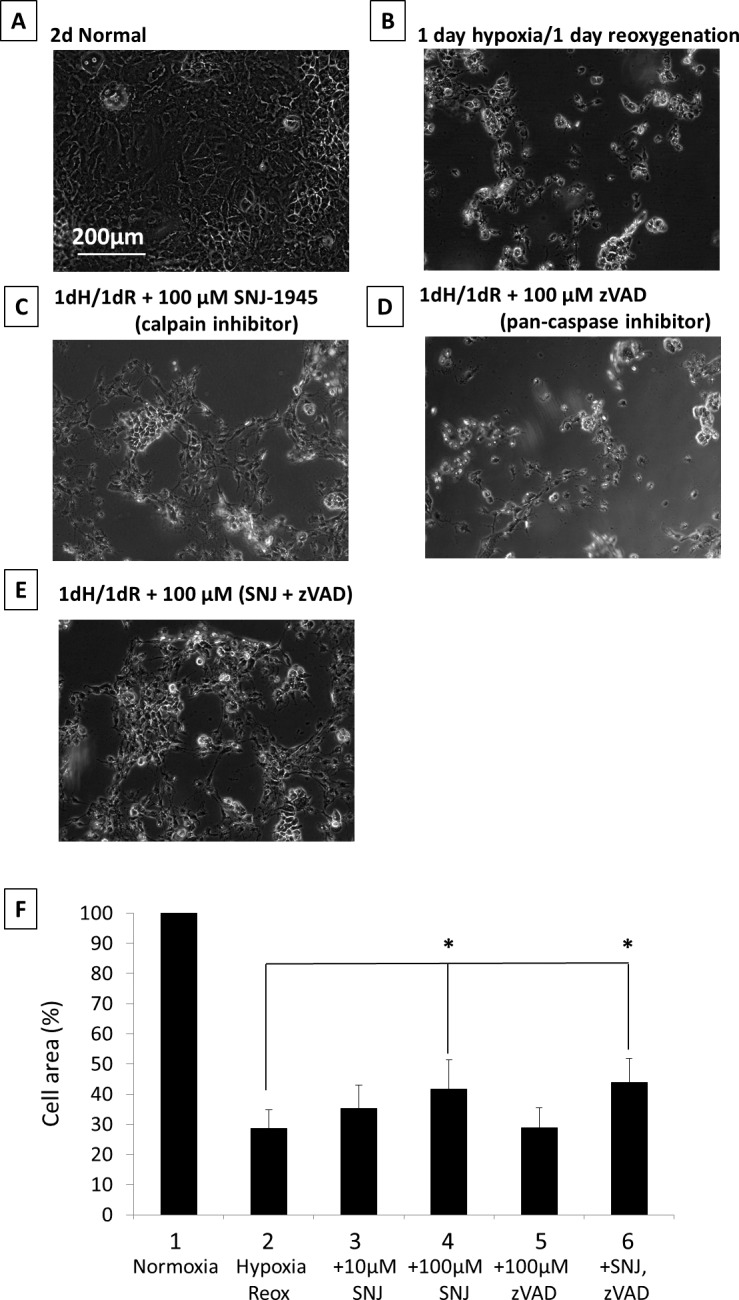
Figure 3.

Phase-contrast micrographs of RPE cells cultured under hypoxia with inhibitors. (A) 2-day normal, (B) 1-day hypoxia/1-day reoxygenation, (C) 1-day hypoxia/1-day reoxygenation + 100 μM SNJ-1945 (calpain inhibitor), (D) 1-day hypoxia/1-day reoxygenation + 100 μM z-VAD (pan-caspase inhibitor), and (E) 1-day hypoxia/1-day reoxygenation + 100 μM SNJ-1945 + 100 μM z-VAD. These images were chosen from the most representative experiment in Figure 4 (n = 5). (F) The bar graph showing the percentage of total area occupied by attached cells in each group compared to normal cells cultured for 2 days. Data are % ± SEM (n = 5 sets, each set was an average of 20 images). *P < 0.05 relative to the hypoxia/reoxygenation group (Dunnett's t-test).
