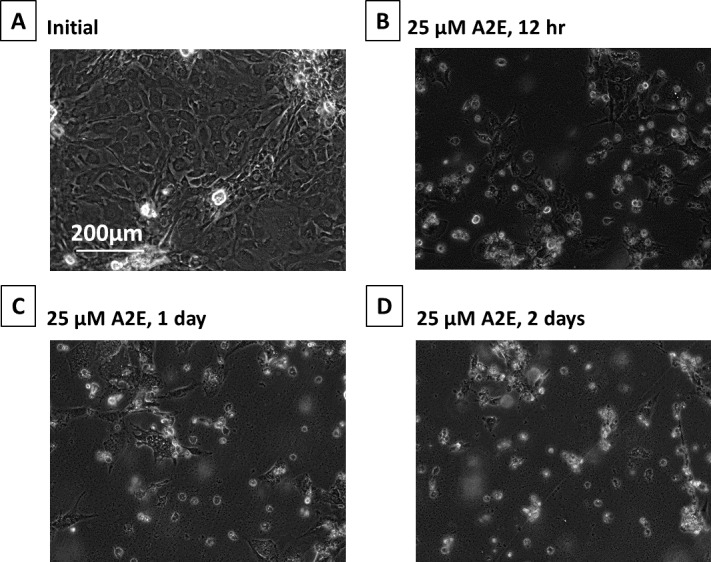
Figure 5.

Phase-contrast micrographs of RPE cells cultured with A2E. (A) Initial, (B) plus 25 μM A2E at 12 hours, (C) 25 μM A2E at day 1, and (D) 25 μM A2E at day 2. These images were chosen from the most representative experiment in Figure 6 (n = 3).
