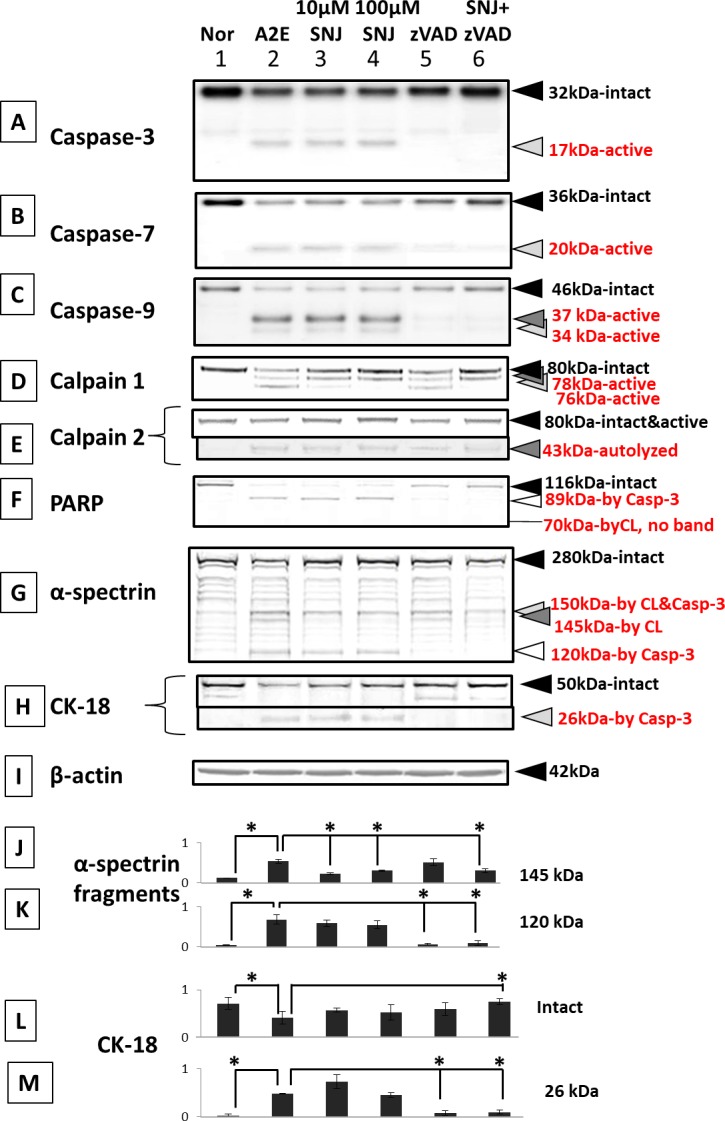
Figure 8.

Immunoblots for caspases, calpains, and their substrates in RPE cells cultured with A2E and inhibitors. (Lane 1) normal, (lane 2) 1-day 25 μM A2E, (lane 3) 25 μM A2E + 10 μM SNJ-1945, (lane 4) 25 μM A2E + 100 μM SNJ-1945, (lane 5) 25 μM A2E + 100 μM z-VAD, and (lane 6) 25 μM A2E + 100 μM SNJ-1945 + 100 μM z-VAD. (A) Caspase-3, (B) caspase-7, (C) caspase-9, (D) calpain 1, (E) calpain 2, (F) PARP, (G) α-spectrin, (H) intact cytokeratin-18 (CK-18) and CK-18 fragment at 26 kDa (caspase-3-specific), and (I) β-actin. The bar graphs show the densities of the bands for the (J) α-spectrin 145-kDa fragment, (K) α-spectrin 120-kDa fragment, (L) CK-18 intact band, and (M) the 26-kDa CK-18 fragment, all normalized to β-actin. Data are expressed as means ± SEM (n = 5). *P < 0.05 relative to A2E (Dunnett's t-test).
