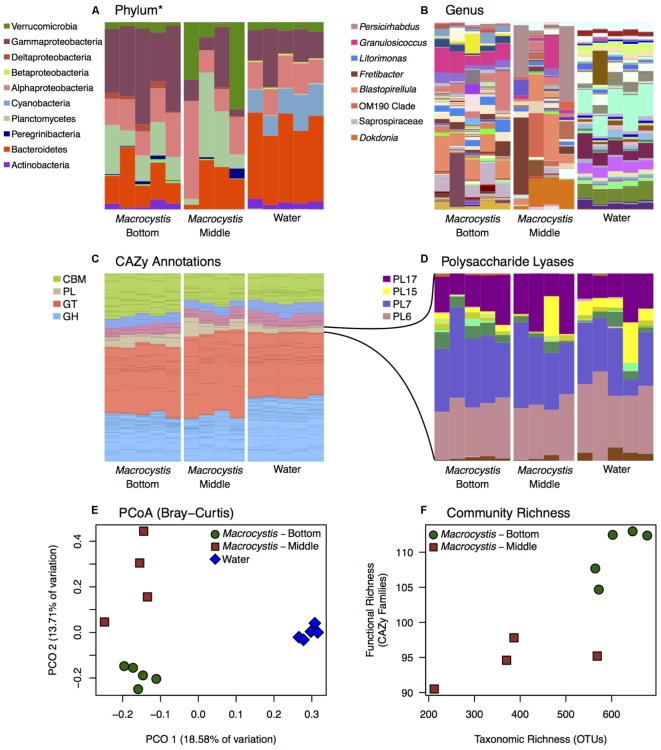
FIGURE 2.
Bacterial taxonomic and functional profiles within a single kelp bed. Bacterial communities from kelp blades at middle (n = 4) and bottom (n = 5) depths, and in the surrounding water column (n = 5), in one kelp bed (Site 3). (A,B) Taxonomic profiles from 16S rRNA gene amplicon sequencing are variable between water and Macrocystis, and across depth. See Supplementary Figure S6 for corresponding taxonomic profiles derived from metagenomic data. (A) Phylum (∗Class for Proteobacteria) level. (B) Genus level (most abundant genera shown in legend). (C,D) Relative abundance of Carbohydrate Active Enzyme (CAZy) annotations from these communities is largely consistent across sample types. (C) CAZy annotations largely fall within Carbohydrate Binding Modules (CBM), Glycosyl Transferases (GT), Glycoside Hydrolases (GH), and Polysaccharide Lyase classes (PL). Enzyme families within these broader groups are represented by stacked bars of the same color. (D) Relative abundance of CAZy families within the Polysaccharide Lyase class. Families PL6, 7, 15, and 17 are the most abundant and almost exclusively contain alginate and oligoalginate lyases. (E) Principle coordinate plot of CAZy annotations constructed from Bray–Curtis dissimilarity matrix shows differences between Macrocystis bottom and middle blades, and the water column, similar to taxonomic composition (statistical tests summarized in Table 2). (F) Functional richness (number of CAZy families) is correlated with taxonomic richness of OTUs in Macrocystis communities (rs = 0.87).

