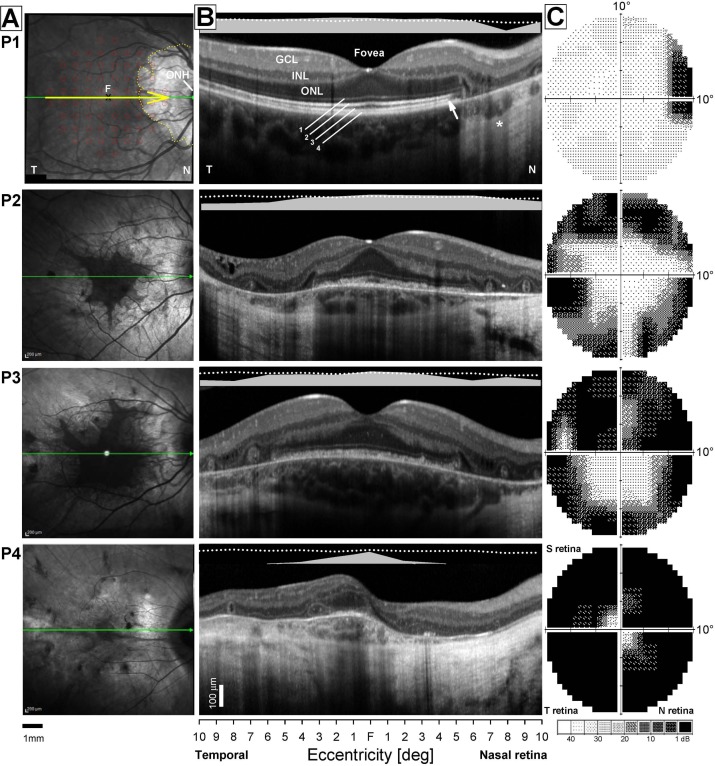
Figure 1.
Central retinal structural and functional changes in the patients. (A) NIR-REF images of the central retina. Images are 30° × 30° centered at the fovea (F). Horizontal green arrows show the position and direction of the SD-OCT scans; overlaid yellow arrow in P1 shows a 6-mm segment used for correlation between SD-OCT and function in B. Dotted yellow line demarcates a pale area of chorioretinal atrophy near the optic nerve head (ONH) that is surrounded by retina with a grossly normal NIR-REF appearance. Overlaid grid of red circles shows the position and size of the visual stimuli (n = 68) used to test the sensitivity of the central retina with the 10-2 protocol in C. Scale bar at bottom. (B) Shown are 6-mm-long horizontal SD-OCT cross sections from temporal (T) through the fovea into nasal (N) retina in the four CHM patients. Scans cover region shown with horizontal yellow arrow in A. Nuclear layers (outer nuclear layer, ONL; inner nuclear layer, INL; ganglion cell layer GCL) are labeled in the temporal retina of P1, which shows a normal retinal architecture. Outer photoreceptor/RPE laminae are numbered (1, outer limiting membrane; 2, inner segment/outer segment region or ellipsoid zone (EZ); 3, interdigitation zone (IZ) between photoreceptor outer segment tips and the apical RPE; 4, RPE/Bruch's membrane [RPE/BrM]). Arrow points to a region closest to the fovea where there is loss of the IZ signal (or photoreceptor outer segment tip), which signals the beginning of a transitional zone (TZ) of increasing structural abnormalities with increasing eccentricity from the foveal center. Apteryx points to region of increased backscattering of the SD-OCT signal caused deeper penetration of the signal through depigmented RPE outside of the TZ. Bars above the scans show psychophysically determined light-adapted sensitivities along a horizontal profile that colocalizes with the region scanned with SD-OCT. Dotted lines above bars define the lower limit (normal mean, 2 SD) of the sensitivity estimates. T, temporal retina; N, nasal retina. Calibration bar to the bottom left. (C) Central visual field sensitivities measured with automated light-adapted static threshold perimetry and a conventional system and clinical protocol (Humphrey Field Analyzer; 10-2 protocol). Maps extend to 10° of eccentricity and are flipped vertically to match the corresponding retinal position of the test grid on the NIR-REF images. Raw sensitivity estimates are plotted as gray scale maps (bottom of column); black areas represent absolute scotomas to this testing protocol (sensitivities ≤0 dB), lighter areas represent better (>30 dB) sensitivities.

