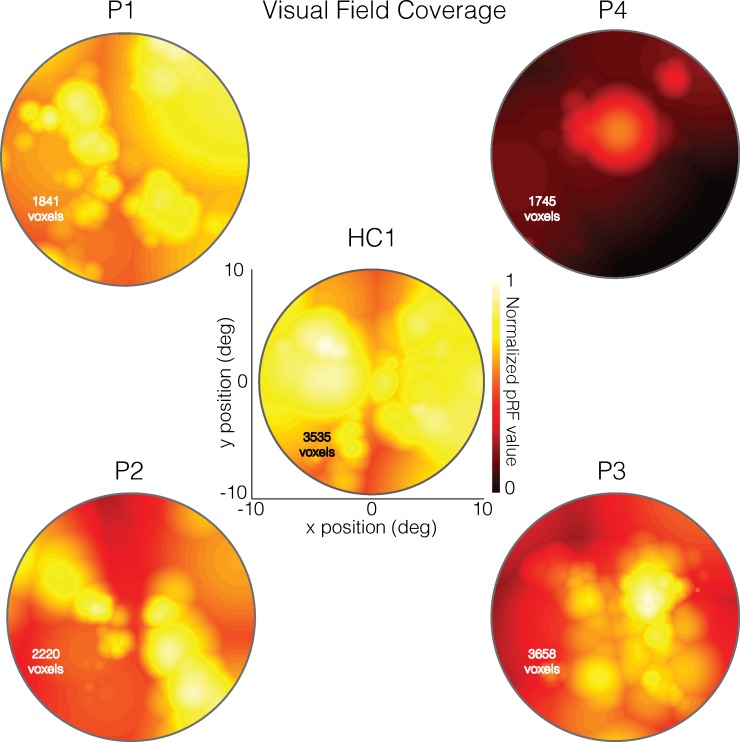
Figure 2.
Left eye pRF visual field coverage maps for four CHM participants and one HC (HC1). To compare the results with individual clinical assessments, visual field data were restricted to +10° and −10° of the entire visual field. These plots represent the maximum pRF coverage at each position in the visual field and were derived from all significantly modulated voxels (>20% explained variance), pooled across both hemispheres. The total number of included voxels is inset onto each map. As shown in the center image, the visual field coverage for a typical HC (HC1) exhibits high pRF values (hot colors) across the visual field except at the extreme upper and lower vertical meridians. Coverage plots for CHM participants are presented relative to the maximum pRF intensity in HC1. As shown here, P1, who had relatively preserved peripheral and central vision, presented with a similar pRF distribution to HC1, albeit patchier and with slightly reduced intensity. Unlike P1, P4 was at a more advanced stage of disease progression, with much more restricted peripheral vision and much smaller preserved central vision. The visual field coverage for P4 is strikingly different from HC1 as well as P1. The two remaining CHM participants (P2 and P3) represent mid-stage disease, and the pRF visual field coverage for these CHM participants are also strikingly different from that of HC1. However, both of these CHM participants show greater degrees of central and peripheral vision as compared with the pRF distribution for P4. P2 showed relatively high pRF values in the upper left and lower right quadrants of the visual field, whereas P3 showed a strong central representation extending further into the lower visual field and a markedly reduced representation of the periphery.

