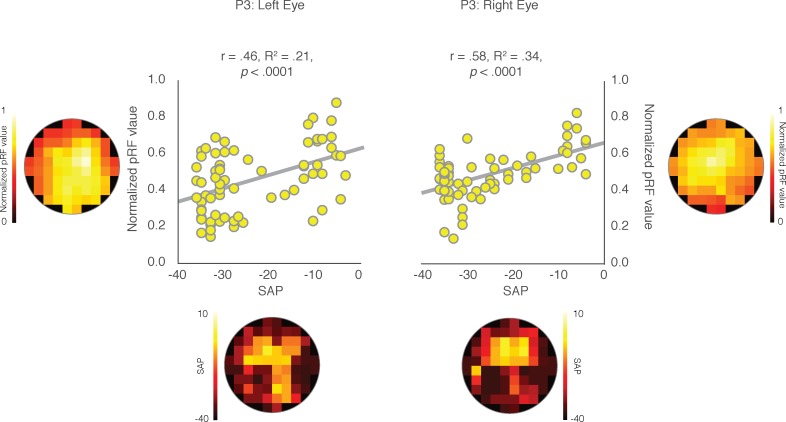
Figure 4.
Pearson's correlation between clinical and pRF measurements for both eyes in P3. As shown on the left, the mean pRF values for each cell location is presented on the y-axis and the corresponding total deviation value, taken from the SAP, is shown on the x-axis. For ease of visual comparison, the calculated pRF and total deviation heat-maps are shown along the “Y” and “X” axes, respectively. The Pearson's correlations between these two measures are plotted for all 68 cells for the left and right eye separately. Significant positive correlations were observed between the SAP and pRF measures for both the left (r = 0.46; P < 0.0001) and the right (r = 0.58; P < 0.0001) eye, demonstrating strong associations between the two measures of visual function in P3.

