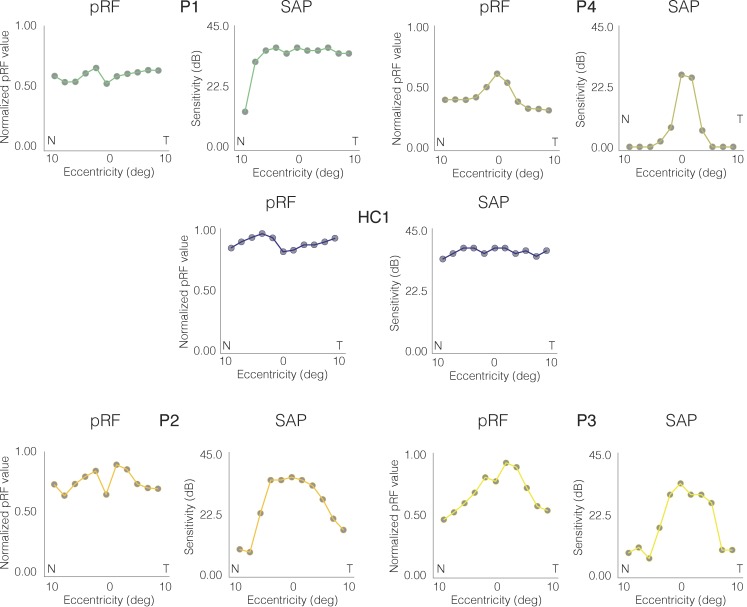
Figure 5.
Clinical and pRF horizontal eccentricity profiles for the left eye of all CHM participants and a representative HC (HC1). In each case, the pRF derived horizontal eccentricity is plotted to the left, with the clinically derived visual sensitivity plotted to the right. Across all plots, horizontal position (deg) is plotted on the x-axis, with the nasal (N) and temporal (T) visual fields labeled. For pRF profiles, the pRF value at that position is plotted on the y-axis, normalized to the maximum pRF value within HC1. For clinical profiles, visual sensitivity (dB) is plotted on the y-axis.

