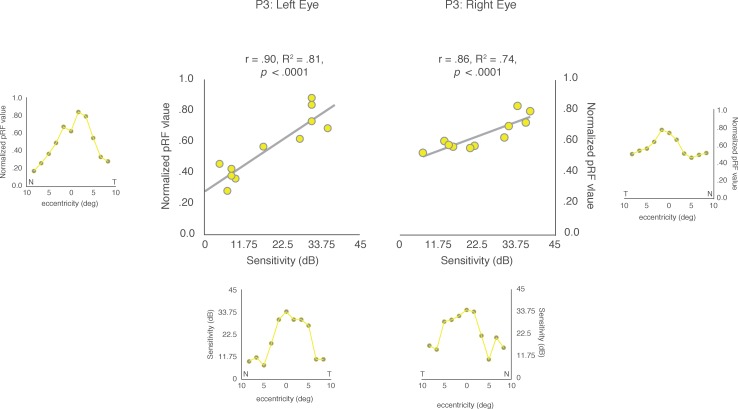
Figure 6.
Pearson's correlation between clinical and pRF eccentricity profiles for both eyes in P3. For ease of visual comparison, the pRF eccentricity profiles are shown next to the y-axes and the values for the clinical eccentricity profiles (recreated from the clinical data) are presented below the x-axes, for both the left and right eyes, respectively. The Pearson's correlations between these two measures are plotted for both the left and right eyes. Significant and positive correlations were observed for both the left (r = 0.90; P < 0.0001) and right (r = 0.86; P < 0.0001) eyes, respectively.

