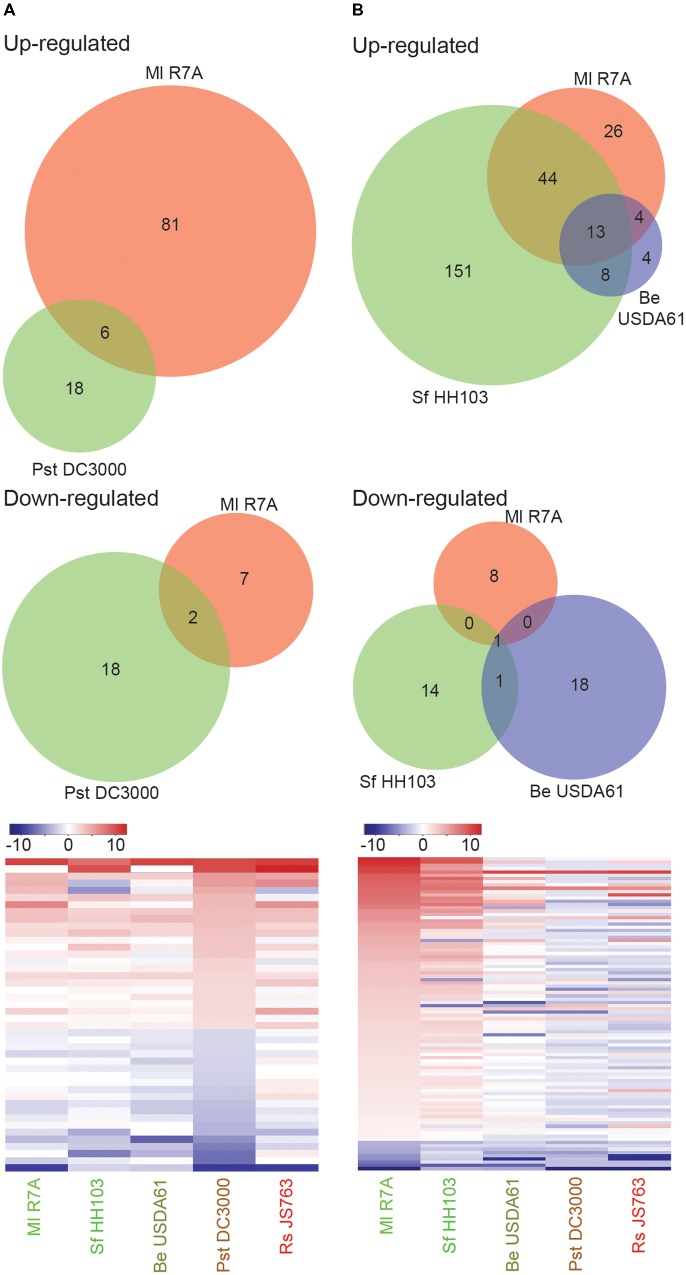
FIGURE 4.
Lotus japonicus root responses to non-adapted pathogenic bacteria and incompatible rhizobia. Venn diagram and heatmap representations of differential gene expression in the indicated conditions compared to H2O controls. Significant gene expression differences were designated based on a fourfold change in expression with a FDR p-value ≤ 0.05. (A) Non-adapted pathogen Pst DC3000 induced differential gene expression. (B) Compatible symbiont Ml R7A compared to incompatible rhizobia Sf HH103 and Be USDA61 differential gene expression. For heatmaps, Log2 fold change values were used.

