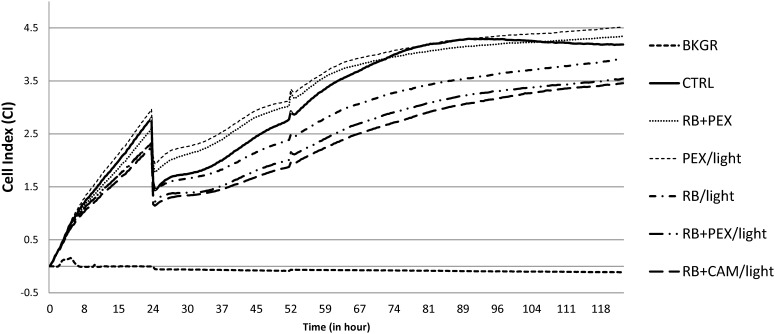
FIGURE 7.
HaCaT cell growth dynamics. Cells were seeded with 104 cells/well, and after the 24 h were treated with an appropriate compound or a combination of compounds. Cell index (CI) was measured every 15 min. An arrow indicates the time of treatment. The presented values are the average of seven replicates. Cells were cultured without any treatment (CTRL), or at logarithmic phase of growth were treated with RB and PEX simultaneously in the dark (RB+PEX), or separately with RB (RB/light) or PEX (PEX/light) in the light. The combinations of photodynamic treatment and antimicrobial peptides was shown as follows: RB and PEX (RB+PEX/light), RB and CAM (RB+CAM/light). The concentrations used were 10 μM for each compound. Cell index in wells containing medium only indicates the background signal (BKGR).

