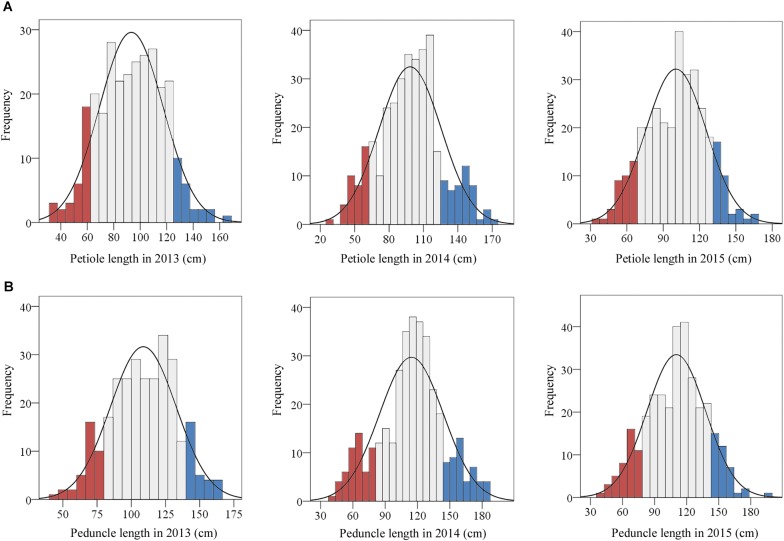
FIGURE 1.
Frequency distributions of petiole and peduncle length in 390 lotus germplasms. The traits were evaluated in 2013, 2014, and 2015. (A) The frequency distributions of petiole length in 2013, 2014, and 2015. (B) The frequency distributions of peduncle length in 2013, 2014, and 2015. The blue and red bars represent the top and bottom 15%, respectively, of the frequency distributions of the traits.

