FIGURE 3.
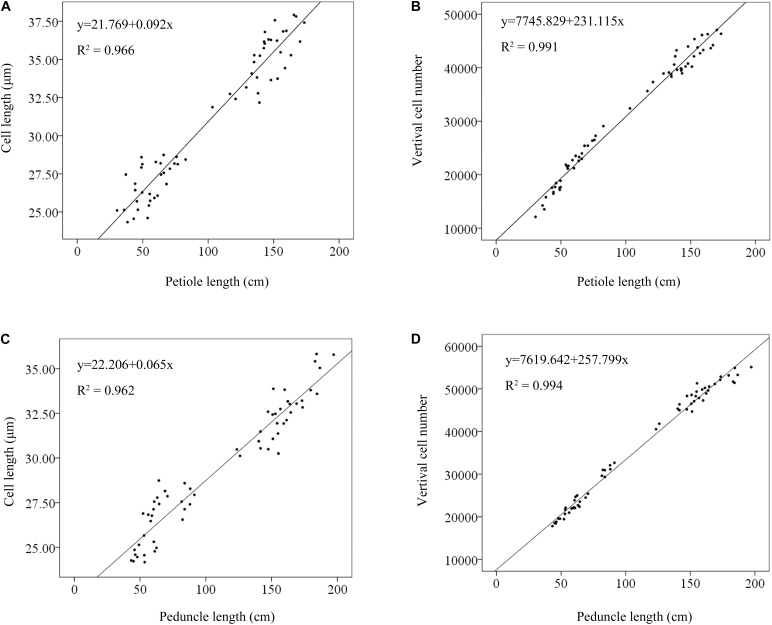
Linear regression analyses of the relationships between cell length and petiole length (A), vertical cell number and petiole length (B), cell length and peduncle length (C), and vertical cell number and peduncle length (D). The solid lines were fitted by regression. Phenotypic data from 10 LA and 10 SA lotus germplasms were used in the linear regression analysis.

