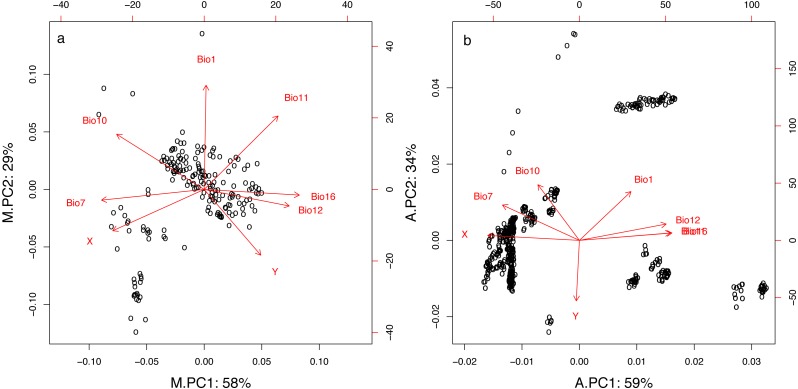
Figure 2. First two principal components resulting from PCA for geographic and climatic variables for mist net (A) and acoustic (B) datasets.
Percentage values represent proportion of the total variation explained by each component. For variables descriptions see Table 1.

