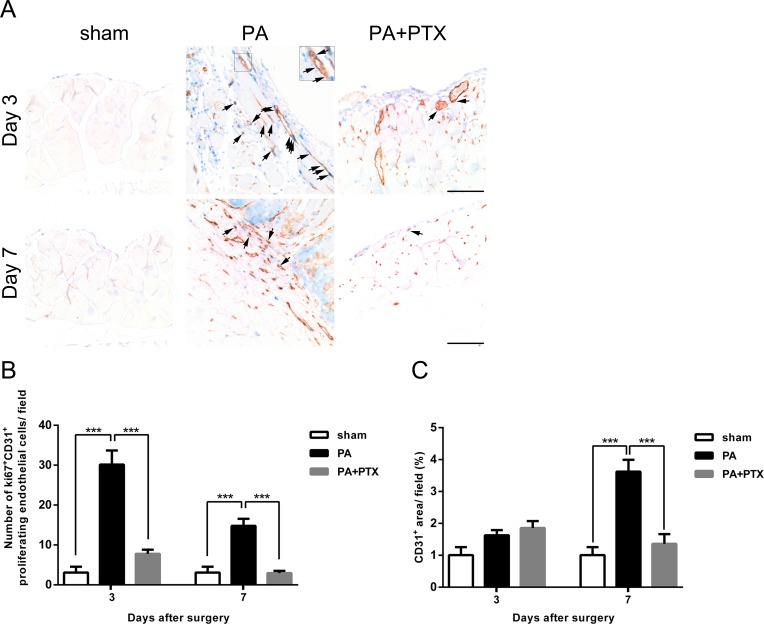
Figure 4. Pentoxifylline treatment reduced angiogenesis.
(A) Representative examples of double immunohistochemistry staining of ki67 (blue) and CD31 (brown-red) (arrows) in peritoneum on day 3 and day 7. (Original magnification, x200, bar = 100 µm). (B) The graph shows numbers of cells expressing Ki67+ and CD31+ (proliferating endothelial cells) on day 3 and day 7. (C) The graph shows the percentage of CD31+ vessel area per field at x200 magnification on day 3 and day 7. Data are expressed as the mean ± SE. ∗P < 0.05, ∗∗P < 0.01, ∗∗∗P < 0.001, respectively.

