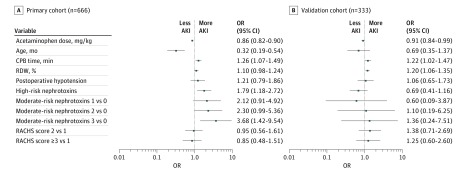
Figure 2. Multivariable Analyses of Acute Kidney Injury (AKI) Among the Primary and Validation Cohorts.
Shown are the odds ratios (ORs) and 95% CIs for each of the clinical variables in the logistic regression analysis for association with acute kidney injury in the primary cohort (A) and validation cohort (B). Odds ratios are for the following: weight-adjusted acetaminophen dose (per each additional 10 mg/kg), age (75th vs 25th percentile for each cohort), cardiopulmonary bypass (CPB) time (per additional 50 minutes), red blood cells distribution width (RDW) (per additional 1%), postoperative hypotension (present vs absent), high-risk nephrotoxins (≥1 vs none), moderate-risk nephrotoxins (1, 2, and ≥3 vs none [see the Population and Electronic Health Record Data Extraction subsection of the Methods for examples of nephrotoxins]), and Risk Adjustment for Congenital Heart Surgery (RACHS) score (2 and ≥3 vs 1). Point estimates and 95% CIs are shown to the right of each plot.

